The RBNZ will be meeting and announcing their rate decision on Wednesday in New Zealand (8 PM ET/0100 GMT). The expectations are mixed (from 0 bps to 50 bps) as the RBNZ ponders putting off an expected hike after the devastating cyclone last week.
Eamonn posted that KiwiBank has weighed-in saying the expected hike of 50 bps may be put on pause given the state of emergency.
KiwiBank commented:
- The RBNZ should pause next week, as we deal with the devastating impact of Cyclone Gabrielle. The RBNZ can come back in April and resume tightening if required.
- Talk of a 50bp, or even 75bp, hike should be sidelined. The comms effort in explaining such a move in the middle of a crisis would be difficult to say the least. And it’s not warranted.
- The need to tighten aggressively from here has evaporated. Inflation is peaking at lower levels. And global inflation pressures are abating. Currently at 7.2%, inflation is below the RBNZ forecast of 7.5%. Tthe balance of risks are tilted to the downside. We think the RBNZ should pause next week. Current circumstances warrant caution. But what we think they should do is not what they will likely do. We expect to see a hike, but the discussion should be around 0 or 25bps, not 50 or 75bps.
ANZ meanwhile said:
- “As the scale of the devastation has been gradually revealed, the market has all but priced out the chance of the RBNZ going ahead with the 75bp hike it signalled last November”
- “Indeed, it’s now pricing a small chance of a pause or just a 25bp hike next week, which is fair”
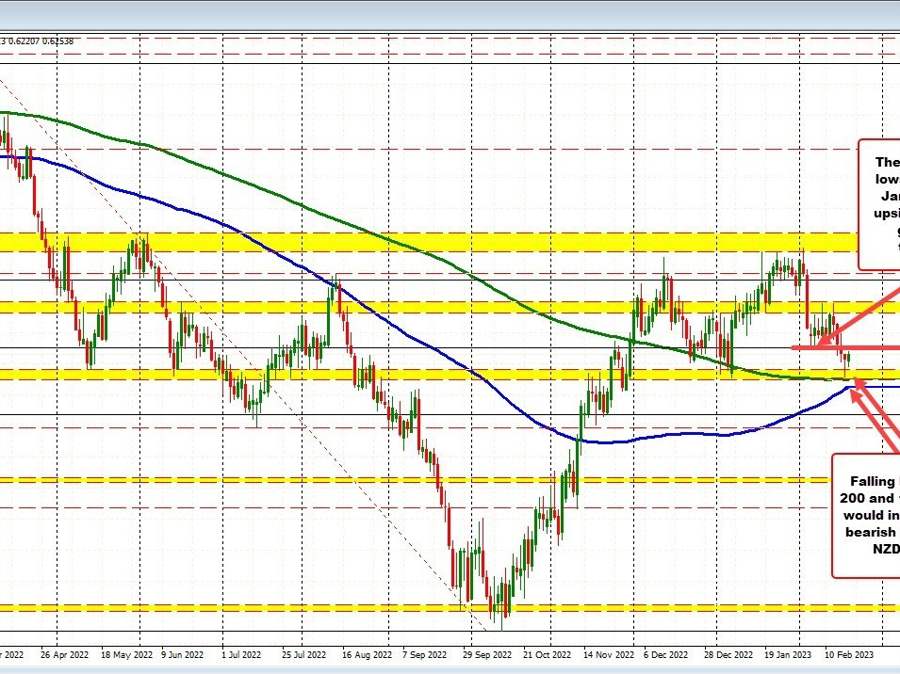
NZDUSD between daily technical levels
Looking at the daily chart of the NZDUSD , the pair moved lower last week, and in the process moved down to test the 200 day MA at 0.61859. The low price reached 0.61933. That was also near the low from January at 0.6190. Below the 200 day MA is the 100 day MA at 0.61645.
Move below each of those MAs would be needed to increase the bearish bias for the pair on the daily chart.
On the topside, the close resistance on the daily chart comes in at 0.62719. That is the 50% of the move down from the April 2022 high to the September low. Earlier this month, the NZDUSD stalled against that level, but broke below it last week.
Drilling to the hourly chart below, the corrective move off the low, has allowed for the 100 hour MA to catch up to the price. That MA currently comes in at 0.6265 and will be tracking even lower as time goes by. Traders will be forced to decide, stay below through the decision or move above?
Move above the 100 hour MA, and the falling 200 hour MA at 0.6297 (and moving lower) would be the next target. The 200 hour MA is tracking down toward the 50% midpoint from the daily chart at 0.62719. It will likely be close to 0.6280 by the time the rate decision is anounced increasing the importance of the area from 0.6271 to 0.6280 as a key topside resistance area to get to and through, to increase the bullish bias.
NZDUSD has the 100 and 200 hour MA catching up to the price
