S&P index erases early declines
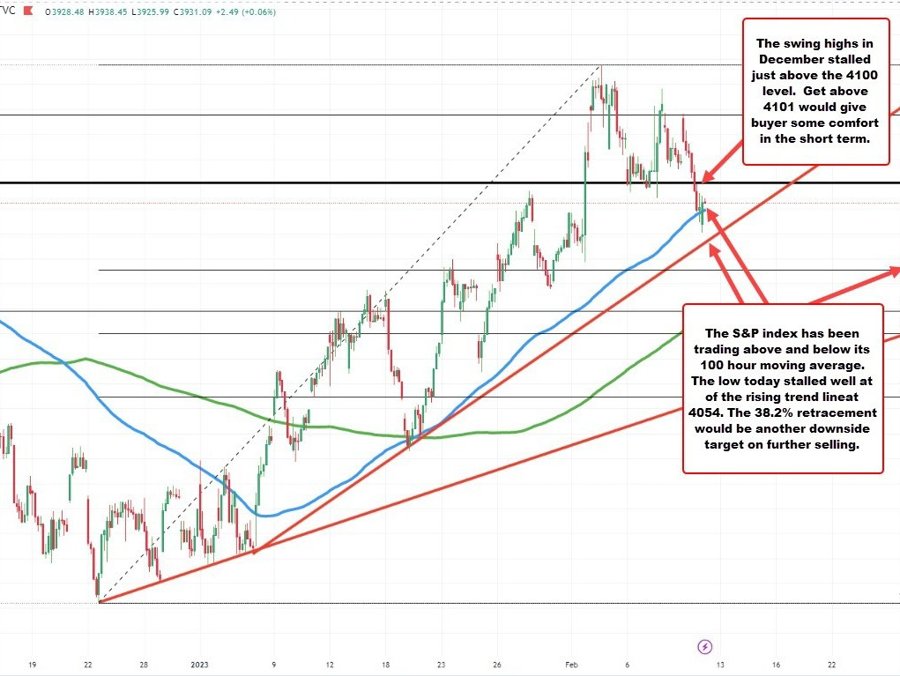
The S&P index has erased earlier declines and trades modestly higher. The index is currently up five points or 0.13% at 4086.68. The high price reached 4090.58. Recall that the swing highs from December stall that 4100.51 and 4100.96. Those levels will be eyed for a short-term bullish clues. Get above and stay above would be more positive for the index.
The price dip yesterday and again today took the price of the S&P index below its 100 hour moving average on its way to the session low at 4060.79. That 100 hour moving average comes in a 4077.71. With the price currently back above that moving average, buyers are trying to force the upside and perhaps a retest of the 4100 area in the process.
Although the price has traded above and below the 100 hour moving average both today and yesterday, it still remains a key barometer for buyers and sellers.
On a break below, and the upward sloping trendline comes into to play as 1st support near 4054. Below that, and the 38.2% retracement of the move up from the December 22 low comes in at 4030.82.
Those two levels would be downside targets (support) to get to and through in order to increase the bearish bias.
