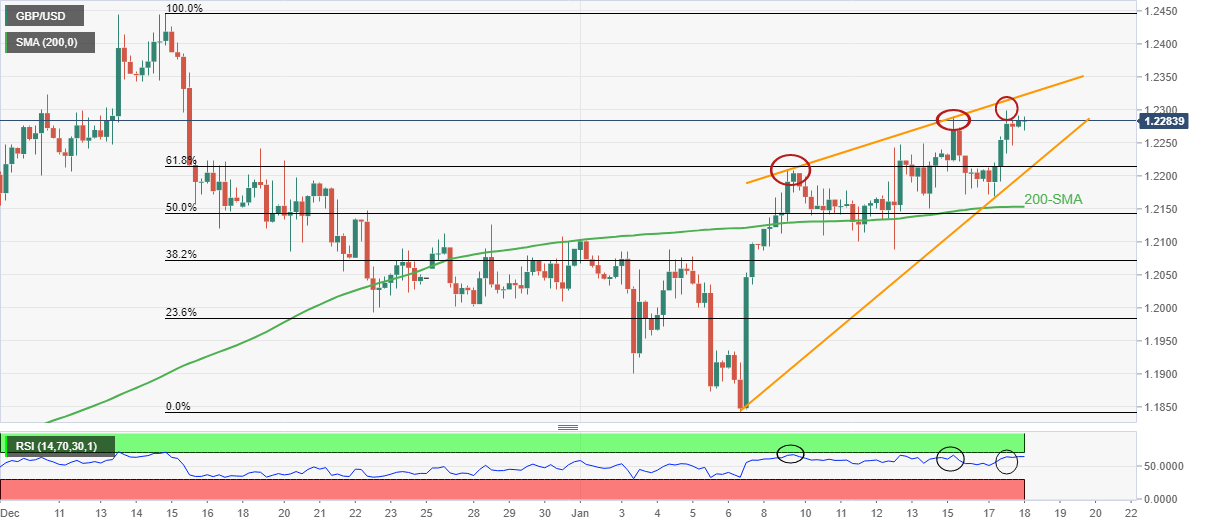
- GBP/USD grinds near five-week high inside bearish chart formation.
- Divergence between higher-high on prices and lower high on RSI (14) tease sellers.
- Upside break of 1.2345 could defy the bearish signals and challenge previous monthly top.
- UK Inflation may disappoint pair buyers amid mixed forecasts.
GBP/USD picks up bids to defend the previous day’s run-up around the 1.2300 round figure, despite posting only 0.08% intraday gains, as the Cable pair traders await the UK’s key inflation data on early Wednesday. Even so, the quote stays inside an eight-day-old rising wedge bearish chart formation.
Not only the rising wedge but bearish RSI (14) divergence also keeps the GBP/USD sellers hopeful. That said, the oscillator’s inability to back the higher-high on prices portrays the bearish RSI divergence.
However, the quote’s current upside could lure GBP/USD buyers if the scheduled UK data offers a positive surprise and allow the pair to cross the stated wedge’s upper line, close to 1.2325 by the press time.
Following that, the mid-December 2022 low around 1.2345 may probe GBP/USD bulls before directing them toward the previous monthly peak surrounding 1.2445.
Alternatively, pullback moves need validation from the 200-SMA level of 1.2153 while the aforementioned wedge’s lower line, near 1.2200 at the latest, restricts the quote’s immediate downside.
It’s worth noting, however, that the GBP/USD weakness past 1.2153 won’t hesitate to refresh the monthly low, currently around 1.1840.
GBP/USD: Four-hour chart
Trend: Further downside expected

