Following on from prior analysis on Monday, EUR/USD bulls remain in a precarious position on the charts, swamped by offers below the 1.0850s following a break of a microstructure around 1.0820. The following depicts the prospects of a significant breakout to the downside for the days ahead.
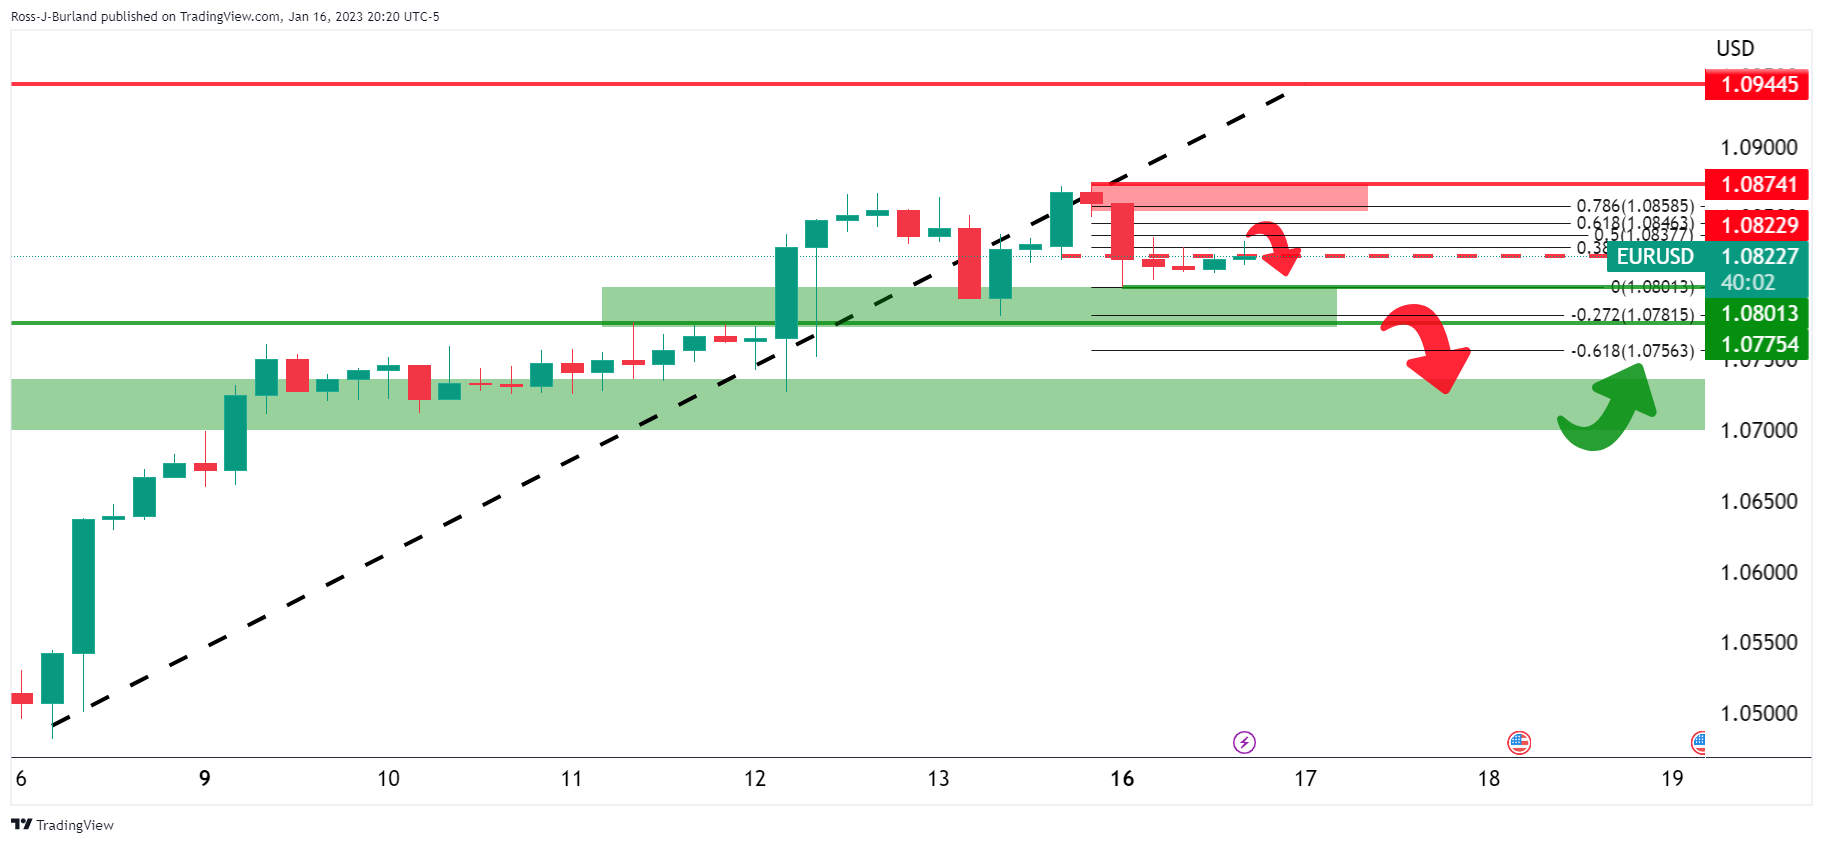
EUR/USD H4 chart
The price is moving into the 38.2% Fibonacci area as measured across the bearish impulse range between 1.0801 and 1.0874. Failures to break above the latter would be expected to see net shorts building up to swallow up the length that will eat into the in-the-money bulls from 1.0700 breakouts.
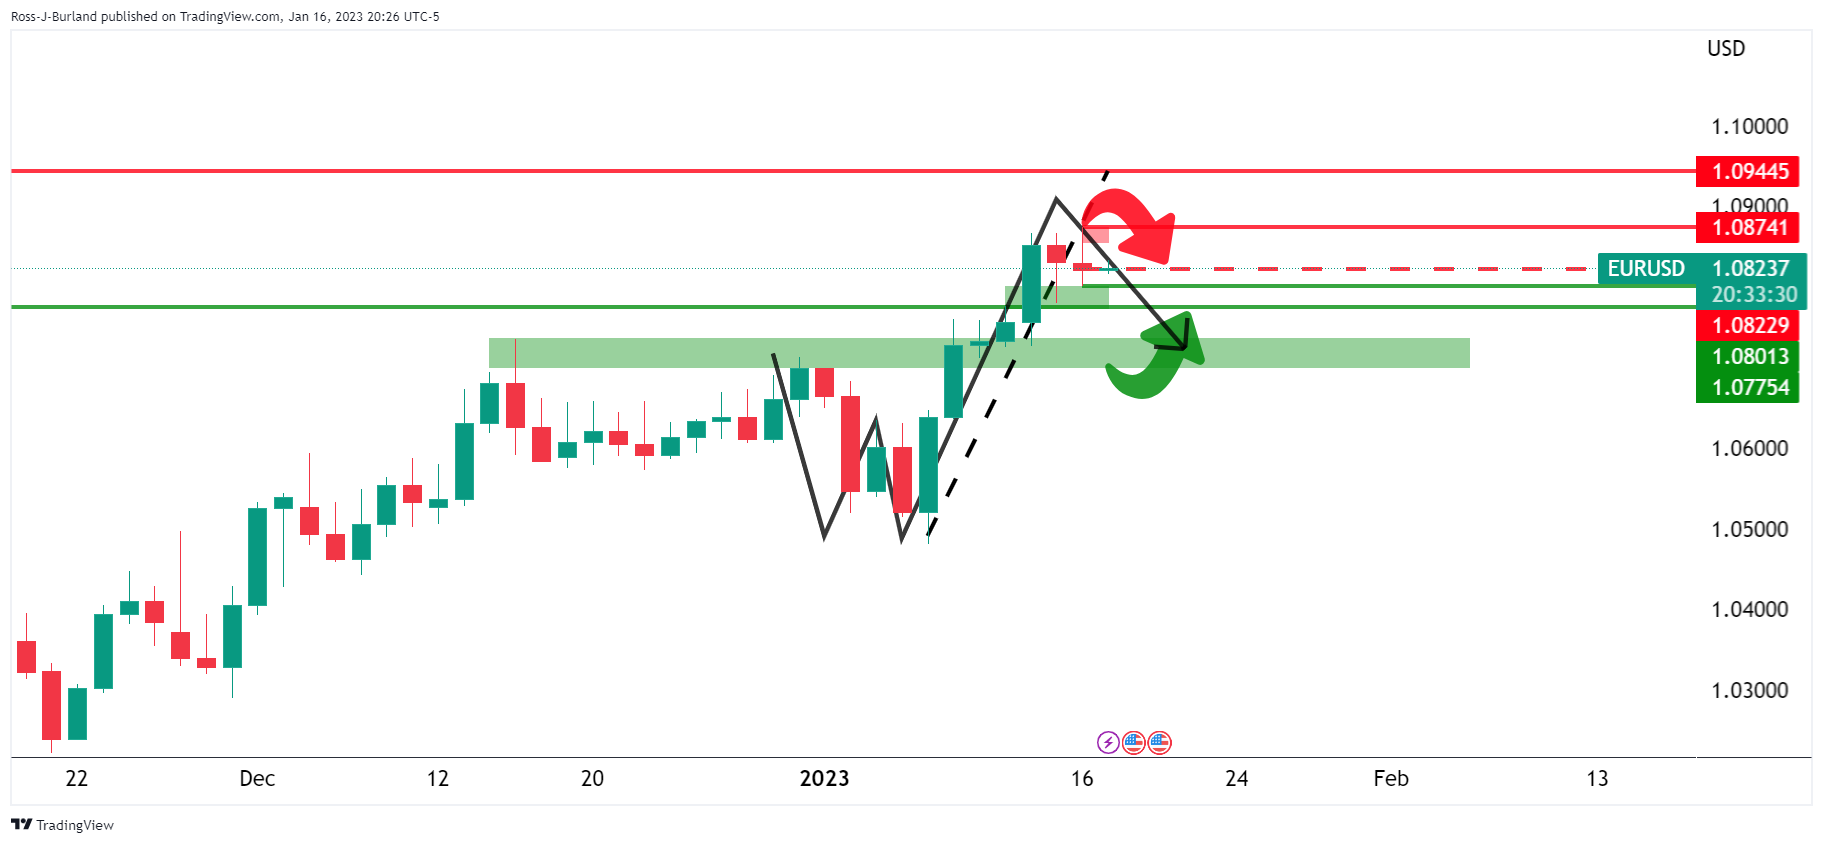
The above thesis is built upon the daily chart’s W-formation as follows:
The W-pattern is a reverison formation and the price is expected to dip into the bullish impulse for a restest for prior structure if not all the way into the neckline.


