The US major indices are closing higher on the day and for the week. All the major indices are closing with gains over 2% on the day. For the week the gains are from around 1% to 1.5% for the major indices.
The final numbers are showing:
- Dow industrial average rose 700.53 points o 2.13% at 33630.62
- S&P rose 86.98 points or 2.28% at 3895.07
- Nasdaq rose 264.06 points or 2.56% at 10569.30
- Russell 2000 or small caps rose 39.60 or 2.26% at 1792.799
For the trading week, the gains for the major indices are showing:
- Dow rose 1.46%
- S&P rose 1.45%
- Nasdaq rose 0.98%
- Russell 2000 rose 1.79%
Technical look at the S&P
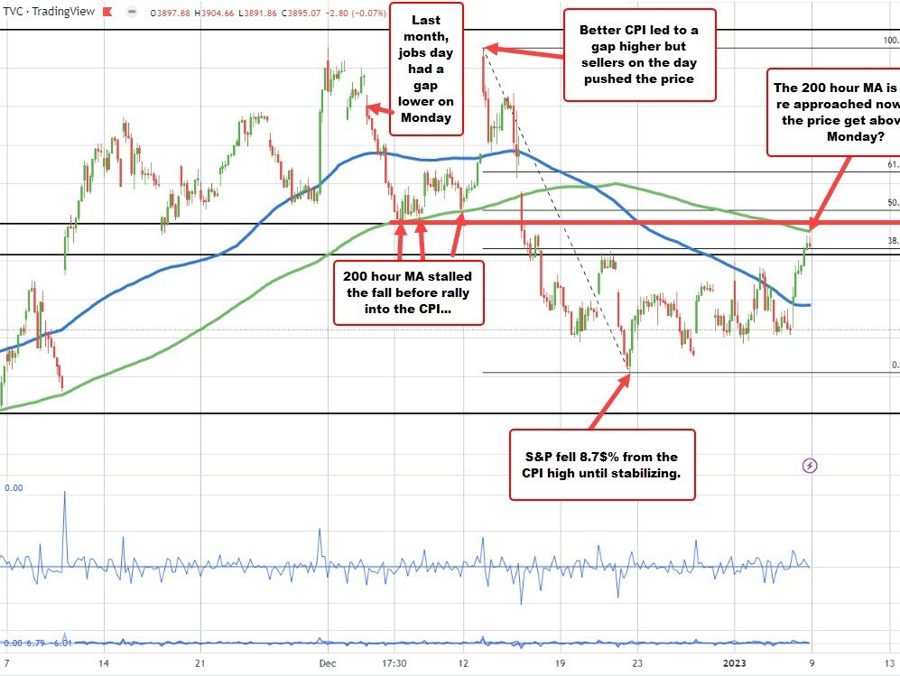
A month ago, after the NFP rally on December 2 which saw the S&P close at 4071, the “Monday After”, gapped lower and traded down to test the then rising 200 hour MA on Tuesday. That MA was around 3818. The price stalled at that 200 hour MA and moved back higher.
Then on CPI day on Tuesday, December 13, the price gapped higher after the better than expected CPI and reached a high of 4100.96 soon after the open. Remember CPI came in better than expected at 0.1% vs 0.3%. The stocks then rotated lower with momentum increasing to the downside. It was a disappointing reaction to the better than expected inflation report.
On Thursday of that week (December 15), the price gapped below the 200 hour MA (green MA line), and did not look back as selling intensified. The low reached 3764.49 on Thursday December 22. The move from the CPI high to the December 22, low was -8.7%.
Fast forward to today, and the price is working it’s way back to familiar 200 hour MA. The high price today reached 3906, which was just short of the 200 hour MA level at 3910.32.
That MA is within 8 points of the 200 hour MA that stalled the fall back on December 6th – the Tuesday after December jobs report.
Monday will be interesting for the US stocks to see if the price can move above the 200 hour MA, and start to trade with a more bullish bias for the first time since December 14th – the day after the CPI.
If it can move above the 200 hour MA, the market will then look toward the upcoming CPI – which will be released next Thursday, January 12.
The expectation for CPI is for the MoM to come in at 0.0% (vs 0.1% last month). The Core is expected at 0.3% vs 0.2%. The headline CPI YoY is expected to come down to 6.5% from 7.1%.
If MoM CPI does come in at 0.0%, the last 6 months would have averaged 0.0167% per month, or 2.0% for 6 months. That is the Fed’s target rate.
Admittedly, the core is still higher. Given the expected 0.3%, the 6 month average would be 0.038% per month or annualized to 4.6% for the year. However, there are things like rents that will keep that higher than expectations.
The point is, if CPI comes in for 6 months at 2.0%, it may be enough to kick the stock market back toward the 4100 That is what the market will decide next week, but first things first, will be can the 200 hour MA be broken?
