The Dow Industrial average was the best of the worst of the major US indices in 2022.
For the year, the major indices showed:
- Dow industrial average fell -8.78%
- S&P index fell -19.44%
- Nasdaq index fell -33.10%
- Russell 2000 fell -21.55%
What stocks in the Dow 30 eased the declines in 2022?
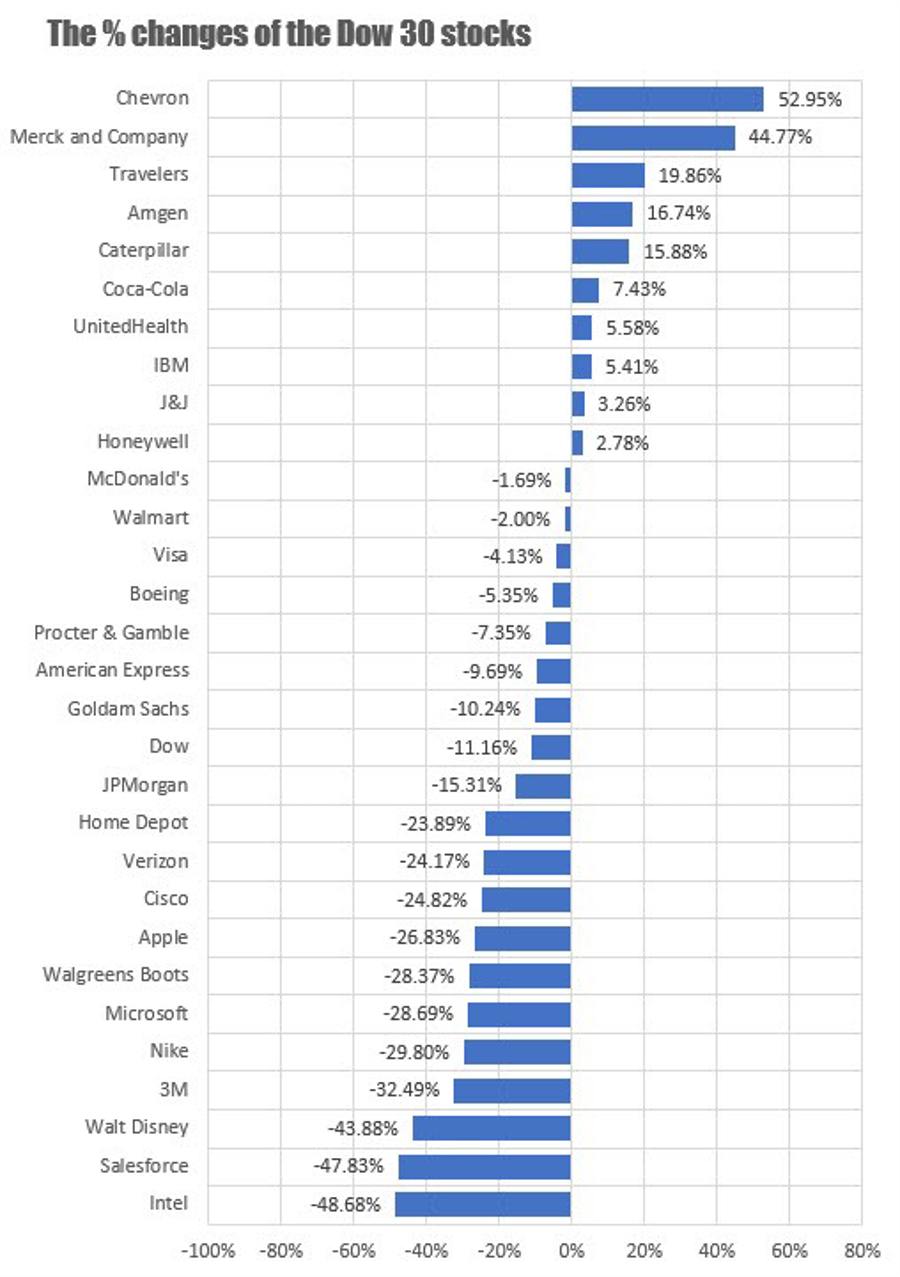
The chart below shows the % gains and loses of the major stocks in the Dow Industrial average. There were a total of 10 stocks which showed gains for the year led by Chevron which gained 52.95%. The biggest loser was Intel which fell -48.68%. A total of 11 stocks fell over 20% including Apple (down -26.83), Microsoft (-28.69%), Disney (-43.88%).
The % YoY changes for the Dow 30 in 2022
The newest addition to the Dow, Salesforce tumbled -47.83%. Salesforce was added on August 31, 2020 and replaced Exxon Mobile. Exxon Mobile was one of the strongest stocks in 2022 with a gain of 80.26%. Since August 31, 2020 when Exxon Mobile was kicked out of the Dow 30, the stock is up 176%.
How has Salesforce fared over the same time period?
Saleforce shares are down -51.3% since being added to the Dow 30.
I wonder how the math would have worked out for the Dow if that switch was not made? Would the Dow have showed a gain in 2022?
Looking at the broader S&P index, the S&P escaped a 20% decline in 2022, but just barely. The S&P fell -19.44% on the year which was the largest decline since 2008, when the index fell -38.49%.
The decline this year was the 4th worst going back to 1974. However, of note is after each sharp decline year, there was a sharp rise the very next year
- In 1974 the index fell -29.74%. In 1975, the index rose 31.55%
- In 2002, the index fell -23.37%. In 2003, the index rose 26.38%
- In 2008, the index fell -38.49%. In 2008, the index rose 23.45%
Something to think about in 2023.
Looking at the 11 components of the S&P index, the energy component was the only gainer with a rise of 59.04%. The Communications and Consumer discretionary were the worst performers with declines of -40.42% and -37.58% respectively.
The gains and loses for the 11 S&P components in 2022

 breakout perfect entry #forex #crypto #trading #trending