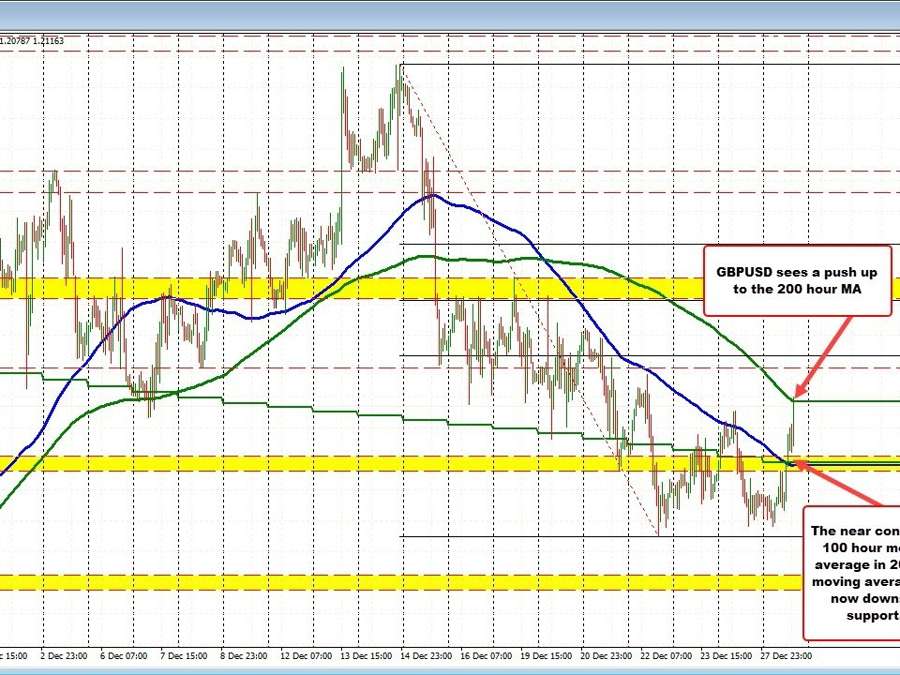
GBPUSD test its 200 hour moving average
The GBPUSD has seen a push higher toward the 200 are moving average 1.2121 (see green line in the chart above). The price fell below that moving average line back on December 15, and state comfortably below the level since that time. A move above would have traders looking toward the 38.2% retracement of the move down from the December high. The level comes in at 1.2165.
On the downside, the price today move back above its 200 day moving average and falling 100 hour moving average. Both those levels come near the 1.2062 level. After breaking higher, the low corrective price stalled at 1.2072. There is also a swing area between 1.2054 1.2069.
This article was originally published by Forexlive.com. Read the original article here.

 This “NEW CONCEPT” Trading Strategy Prints Money!… (INSANE Results!)
 breakout perfect entry #forex #crypto #trading #trending
