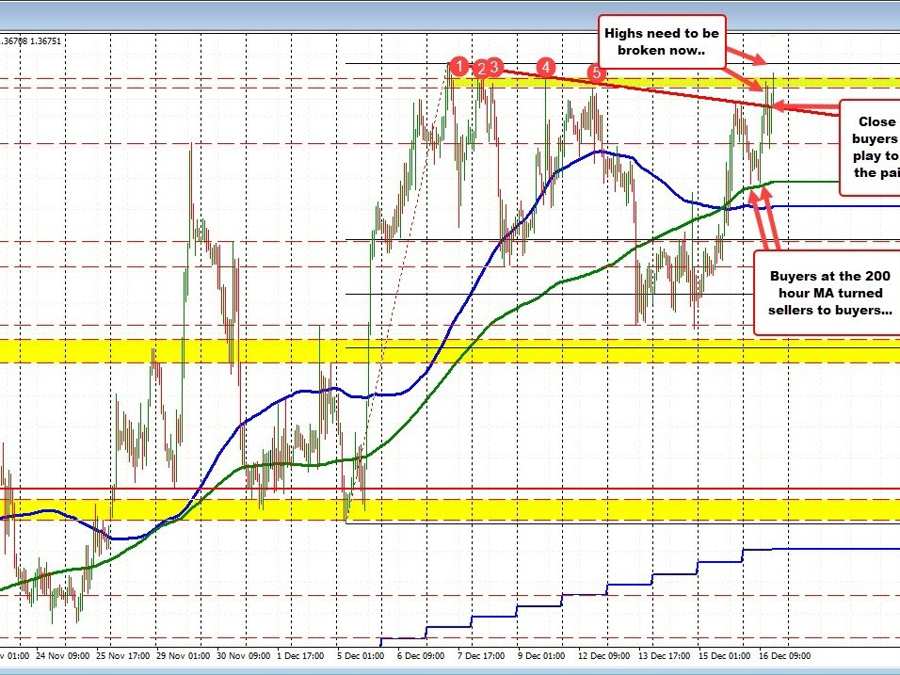
USDCAD tests the highs after bouncing off 200H MA
The USDCAD is moving to a new high for the day, and in the process is extending toward the high from December at 1.3699. The price just traded to 1.3293.
Looking at the hourly chart, the price action today initially moved to the downside testing the rising 200 hour moving average (green line in the chart above) currently at 1.36183. After bouncing off the moving average on two separate occasions, the sellers turned buyers and force the price back to the upside.
The pair moved above a downward sloping trendline connecting recent highs which were progressively lower, and the first attempt failed. The second is “in progress”. Stay above the broke trend line around 1.36708 keeps the buyer in firm control, with the 1.3700 level the hurdle to get to and through.
Crude oil price are lower today as China woes move from Covid lockdown to Covid spreading. The price of WTI is trading down -$2.60 at $73.48. The high this week reached $77.75. The price is moving away from the 100 hour MA (blue line in the chart below), and more recently below the 200 hour moving average at $74.24 (green line in the chart below). Lower oil prices help to depress the price of the CAD (higher USDCAD) at times.
Crude oil is trading lower
