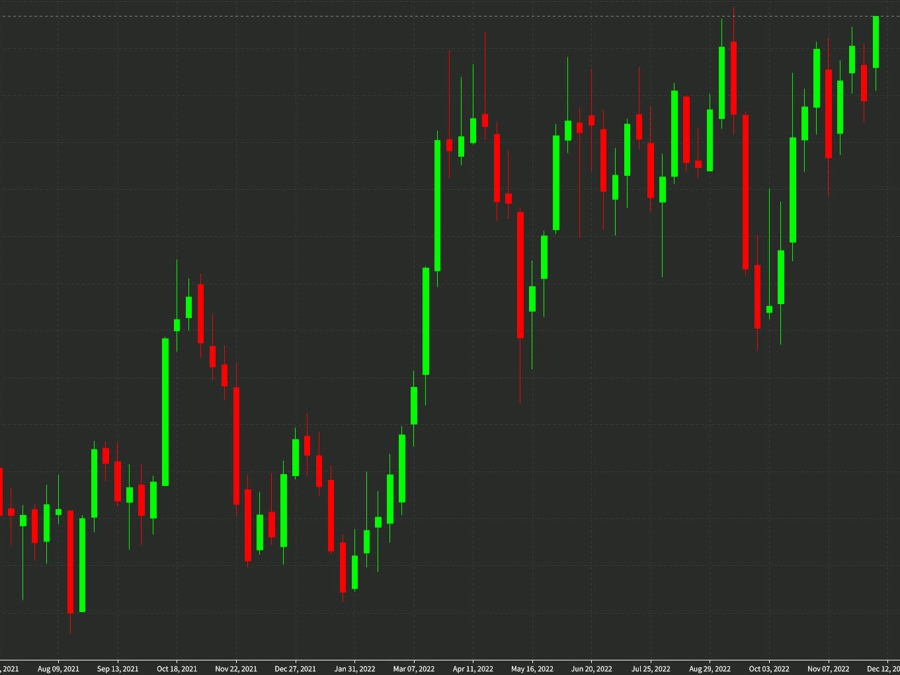
NZDJPY weekly chart
The NZD/JPY weekly chart is one of the more-interesting ones out there right now as it brushes up against the September high. If that breaks, it will take the pair all the way back to 2015 levels and a time when the pair touched 94.00.
The general feeling is that yen weakness is over after the spike in USD/JPY to 150.00 but this chart and some others argue that USD weakness is more the case.
Lately, the antipodean currencies are benefiting from speculation around China reopening and AUD/JPY also posted a decent week.
The rise in the pair is also reminiscent of the old carry trade. The RBNZ cash rate is now at 4.25% and another 50 bps is expected in February. That’s a hefty carry over zeroed out JPY rates, though risks around global economic growth are high.