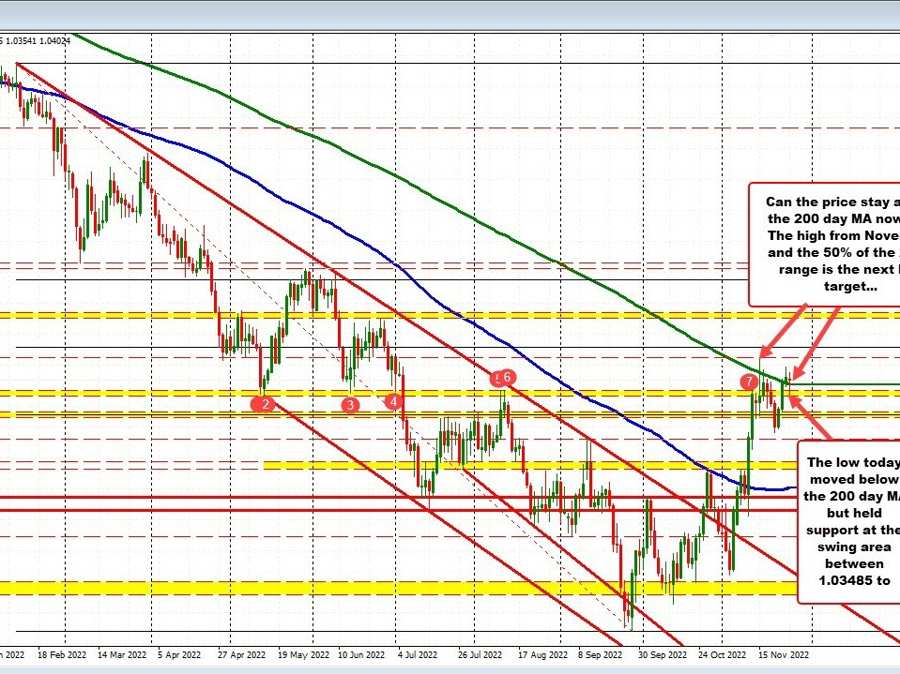
EURUSD on the daily chart
The EURUSD fell back below the 200 day moving average at 1.03875 and extended down to a low price of 1.0354. That low entered into a swing area going back to May June and July. The lows in May and June stalled within that area. On July 1, the price also stalled within that area before breaking lower on July 5. Fast-forward to August, and the corrective high in that month stalled within that area (see red numbered circles in the chart above).
In November, the price has traded above and below the swing area with the 200 day also in play. Today however, support held within the swing area and the price has pushed back above the 200 day moving average on the positive hold for the buyers.
Admittedly, in the month of November, the price has traded above and below the 200 day moving average on four separate days. There has been some reluctance to the topside. If the buyers are to take more control, getting and staying above the MA is needed. The high from November at 1.04798 is the next target, followed by the 50% midpoint of the 2022 range at 1.05155 (see daily chart.
On the hourly chart, the lows today also stalled ahead of the 100/200 hour MA near 1.0350.
EURUSD bottoms near the 100/200 hour MA
