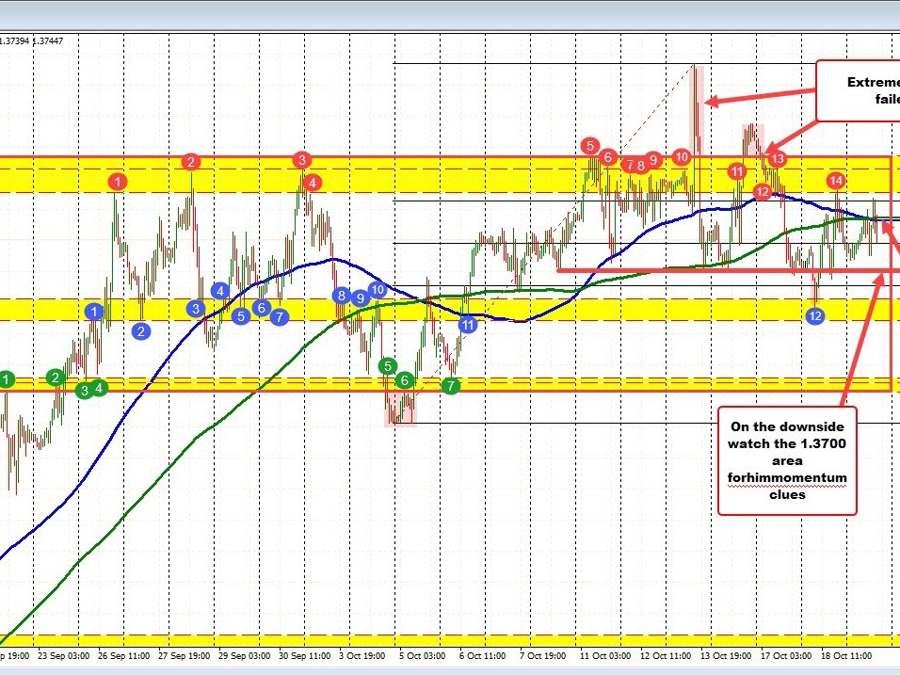
USDCAD chops up and down
The USDCAD is a chopping up and down with the 100/200 hour moving averages converged near 1.3774 (see blue and green lines in the chart above). When the 2 averages converged it is indicative of a non-trending up and down trading market. Looking at the hourly chart since September 21, the price has spent most of the trading time between 1.3543 and 1.38548. Last week there were breaks to the upside that could not be sustained.
On the downside early in the month, the price fell below the lower extreme over a 2 day calendar, but that momentum could not be sustained as well (see red shaded area on the chart above). The head of the lower extreme is a another swing area between 1.3637 and 1.3666.
With the price chopping up and down, traders need to be flexible. It is also important to understand risks and target levels.
Looking at the hourly chart, going back to September 26, the price high reached 1.3807. Then on September 28 and September 30, the price moved above that level toward highs near the 1.38375 area before rotating back to the downside on each of those attempts.
Fast forward to trading yesterday, the price moved back toward the 1.38072 level and found willing sellers. Today, the high price stalled ahead of the 1.38072 level. The high price reached 1.37992 (which is also just below the natural 1.38000 level.).
As a result of that the price action, the 1.3800 to 1.38072 area is a barometer above the 100 and 200 hour moving averages to eye. Get above and stay above would have traders targeting the 1.3837 followed by the 1.38548 swing high areas.
On the downside, the technical patterns are little less defined. Getting back below the 50% retracement at 1.37397 and staying below should be a tilt to the downside. Below that the 1.3700 area, would be another tilt more to the downside ahead of the swing area between 1.3637 and 1.3666. Traders would want to see a break below the 1.3700 level and stay below that level.
Up and down consolidation can lead to false breaks. So be aware. The price action is reflective of a market that is unsure of the next move. We have to be accepting of that feeling and respect it as well. At some point the market will break and run. As a result knowing the levels and following the price action is important. Managing expectations is also a good practice until there is a clearer picture.
