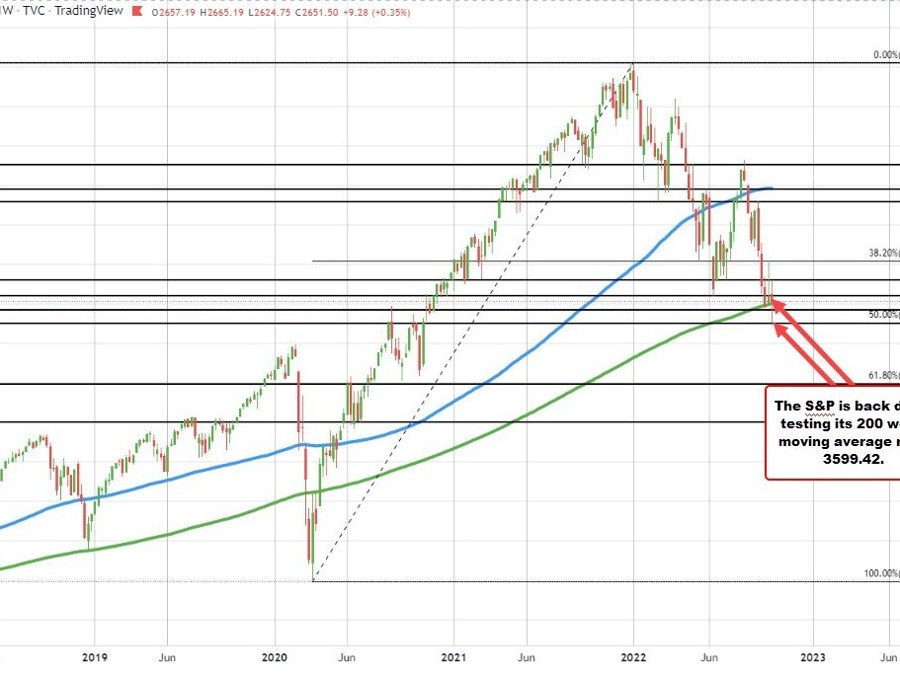
S&P is back below the 200 week moving average
The major US stock indices are rushing to the downside and trading to new lows for the day.
The NASDAQ is leading the way with a decline of over 2.00%. Coming into the day, the NASDAQ was near unchanged for the week.
For the S&P index is trading down -1.67% at 3608. That is within about 9 points of its 200 week moving average at 3599.42. two weeks ago, the NASDAQ closed just below the 200 week moving average but recovered last week. A close back below the moving average would tilt the bias back to the downside off of the longer term chart.
Yesterday, the S&P index moved down to test its 50% midpoint of the move up from the March 2020 low. That level came in at 3505.24. The low price yesterday reached 3491.58 before recovering quickly to the upside. The 50% midpoint would be a another target to get to and through on more selling pressure
