- USD/MXN fails to break key resistance near 20.20.
- Break above 20.20 to give momentum to the dollar.
- Price continues to consolidate around 20.00.
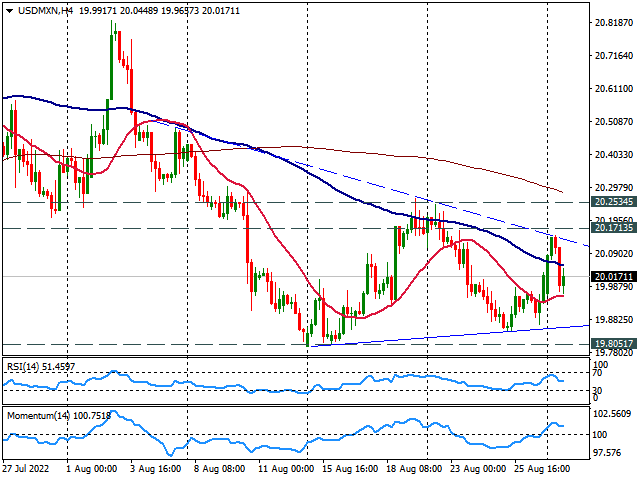
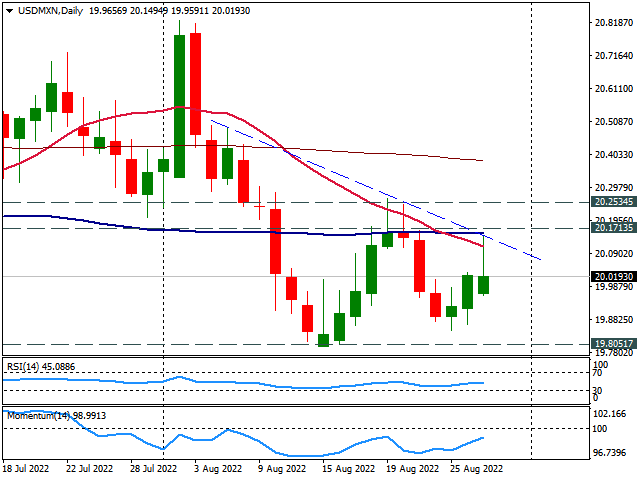
The USD/MXN is flat on Monday as it pulled back after reaching the highest level in almost a week at 20.16. The pair tested a critical resistance area around 20.17, the convergence of a short-term downtrend line and the 20 and 200-day Simple Moving Average.
A break above 20.20 should give momentum to the US Dollar and a close above 20.25 would point to more gains, with the next resistance located at 20.45.
A slide under 19.98 should put the Mexican peso to test the 19.90 support area. A break lower would expose the August low around 19.80, a strong support level that would likely hold, favoring a rebound to 19.90 before a break lower.
On a wider perspective, USD/MXN continues to consolidate around 20.00, moving without a clear direction. With the price under key daily moving average the bias is to the downside with momentum under 100. Although other technical indicators like the RSI are flat around midlines.


 RULE-BASED Pocket Option Strategy That Actually Works | Live Trading