- The USD/CHF is snapping two consecutive weeks of losses, gaining 1.37%.
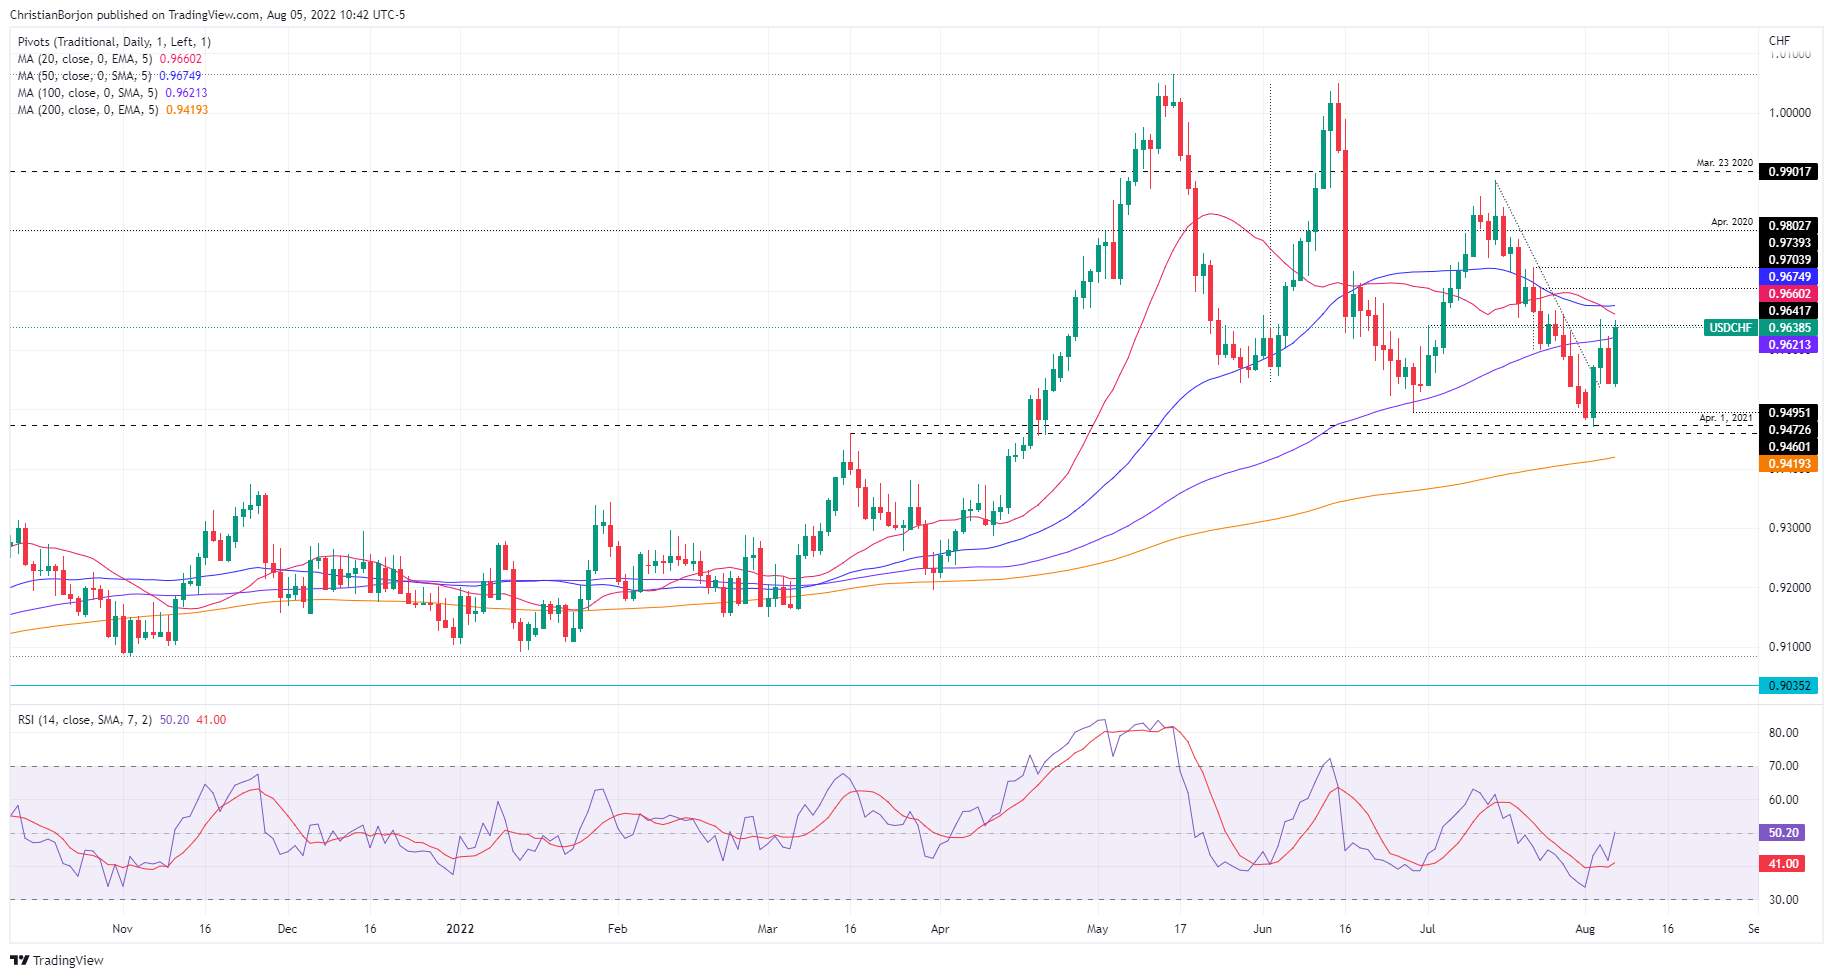
- From the daily chart perspective, the major is headed upwards and will test resistance around 0.9669-75.
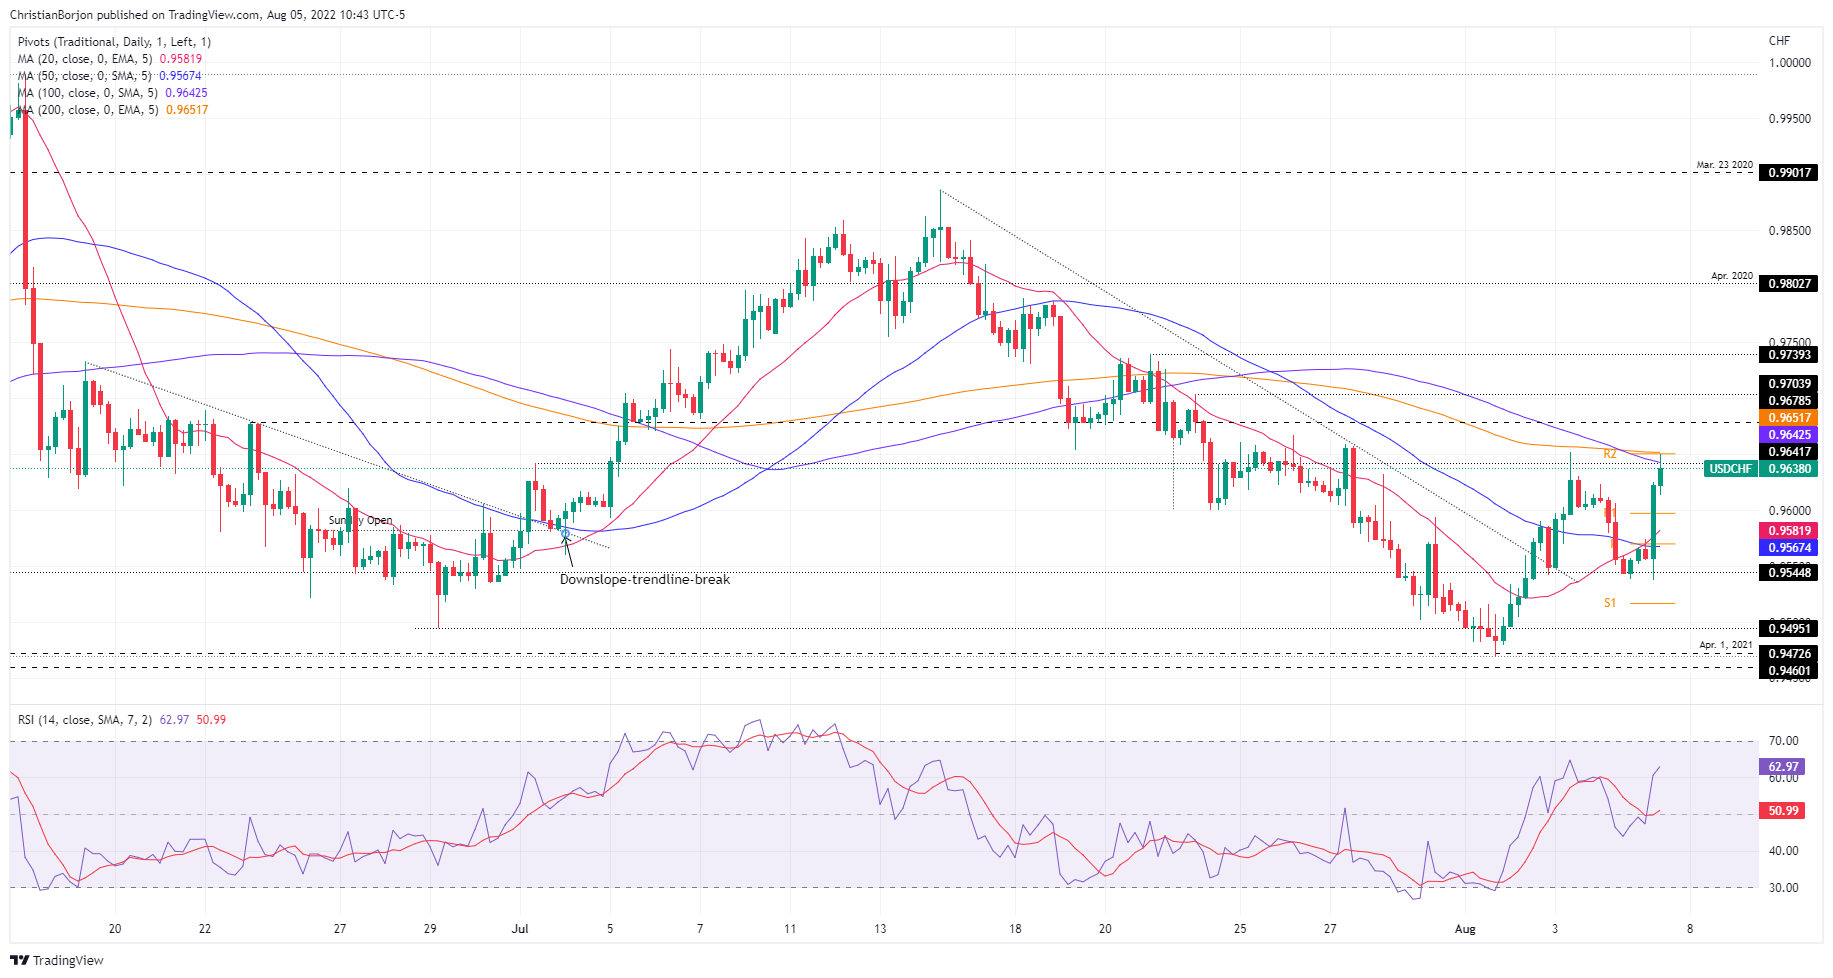
- If USD/CHF buyers conquer 0.9642-50, a move towards 0.9703 is on the cards.
The USD/CHF is surging during the North American session after hitting a daily low early in the Asian session at 0.9538. Still, positive US economic data spurred a jump towards the daily high at 0.9644, shy of the weekly high at 0.9651. At the time of writing, the USD/CHF is trading at 0.9638.
USDCHF Price Analysis: Technical outlook
The USD/CHF daily chart illustrates the pair as upward biased, further reinforced by the Relative Strength Index, crossing above the 50-midline, displaying that buyers are gathering momentum as the exchange rate approaches a substantial resistance area at the confluence of the 20 and 50-day EMAs, in the 0.9660-75. A decisive break would clear the way towards the July 14 daily high at 0.9886.
In the 4-hour scale, the USD/CHF tests the confluence of the 100, 200-EMAs and the R2 daily pivot point, in the 0.9642-52 area, which ounce cleared, could pave the way for the USD/CHF towards the July 22 high at 0.9703. Even though it’s a clouded area, the Relative Strength Index reading at 64 still has some room to spare if buyers step in to push prices higher.
On the other hand, if USD/CHF resistance holds, the major could dip towards the R1 pivot point at 0.9600.


