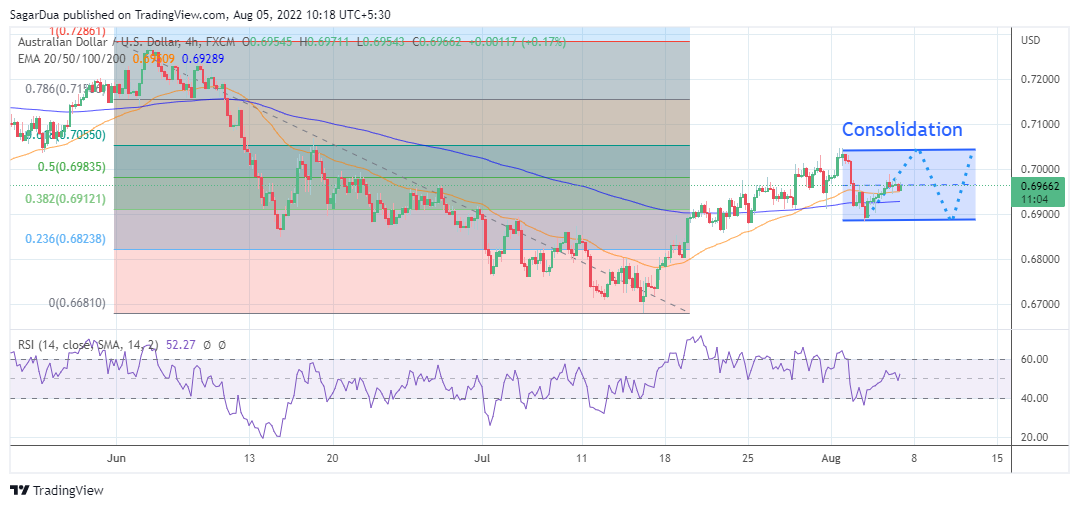
- Aussie bulls are facing barricades around 50% Fibo retracement at 0.6983.
- The asset is expected to remain sideways in the 0.6890-0.7045 range.
- The 200-EMA has turned flat while the 50-EMA is overlapping with the asset prices.
The AUD/USD pair is displaying back and forth moves in a narrow range of 0.6945-0.6976 in the Asian session. The asset has turned sideways after a responsive buying action from a cushion below 0.6900. Usually, a responsive buying action indicates the initiation of significant longs by the market participants as they find the asset price a value bet.
On a four-hour scale, the aussie bulls are facing barricades around the 50% Fibonacci retracement (which is placed from June high at 0.7283 to July 14 low at 0.6707) at 0.6983. This has pushed the asset into a charted territory. The asset will consolidate in a 0.6890-0.7045 range ahead.
The 200-period Exponential Moving Average (EMA) at 0.6930. Also, the 50-EMA at 0.6952 is overlapping with the asset prices, which signals a consolidation ahead.
Adding to that, the Relative Strength Index (RSI) (14) has shifted into the 40.00-60.00 range, which indicates that the asset is awaiting a potential trigger for a meaningful move.
A decisive move above the six-week high at 0.7047 will send the major towards the round-level resistance of 0.7100, followed by May 31 high at 0.7204.
Alternatively, a downside break of the above-mentioned consolidation, which is in a 0.6890-0.7045 range will drag the asset towards a 23.6% Fibo retracement at 0.6823. A slippage below 23.6% Fibo retracement will trigger the downside risk to July 5 low at 0.6761.

