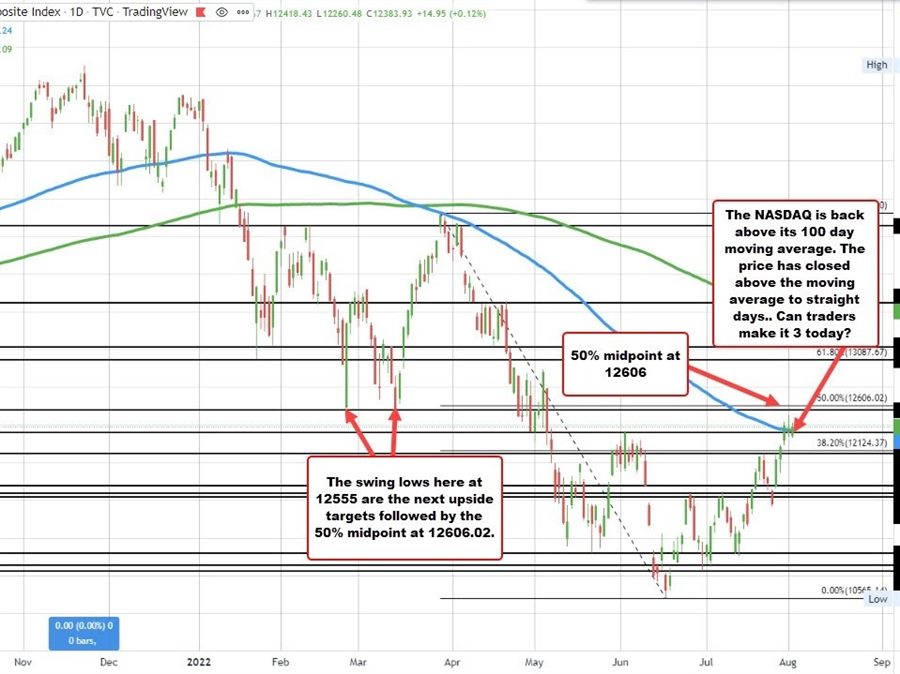
NASDAQ trades above the 100 day moving average
The NASDAQ index is back in positive territory after moving lower earlier in the session. The low price reached 12260.48. The high price has extended to 12418.43. The current prices trading at 12389.50 up 20.67 points or 0.17%.
The last 3 trading days has seen the NASDAQ index traded above and below its 100 day moving average. That moving average currently comes in at 12336.29 today.
The price last close above its 100 day moving average back on January 4 at the start of the new trading year. In March and April, the price tested that moving average but found willing sellers against the level. At least now, the price has been trading above and below the moving average level with 3 straight days of closes above.
Admittedly, the moving averages much lower than it was in March and April. As a result the hurdle is easier. However, a break and move away is still a positive shift in the technical bias on
So the buyers are making a play. Can they keep the momentum going and move away from the moving average. The next targets come against a swing area at 12555.35. Above that is the 50% midpoint of the move down from the March 2022 high. That level cut across at 12606.02.
