- June’s US Nonfarm Payrolls report exceeded expectations, further cementing the case for a Fed’s 75 bps rate hike.
- The consensus amongst ECB policymakers is for a 25 bps rate hike in July; September is still open.
- EUR/USD Price Analysis: Sellers in control might take a breather before launching an assault towards parity.
EUR/USD remains subdued as North American traders prepared for the weekend, in choppy trading within the 1.0150-80 range after June’s employment report and further Fed speakers crossing wires.
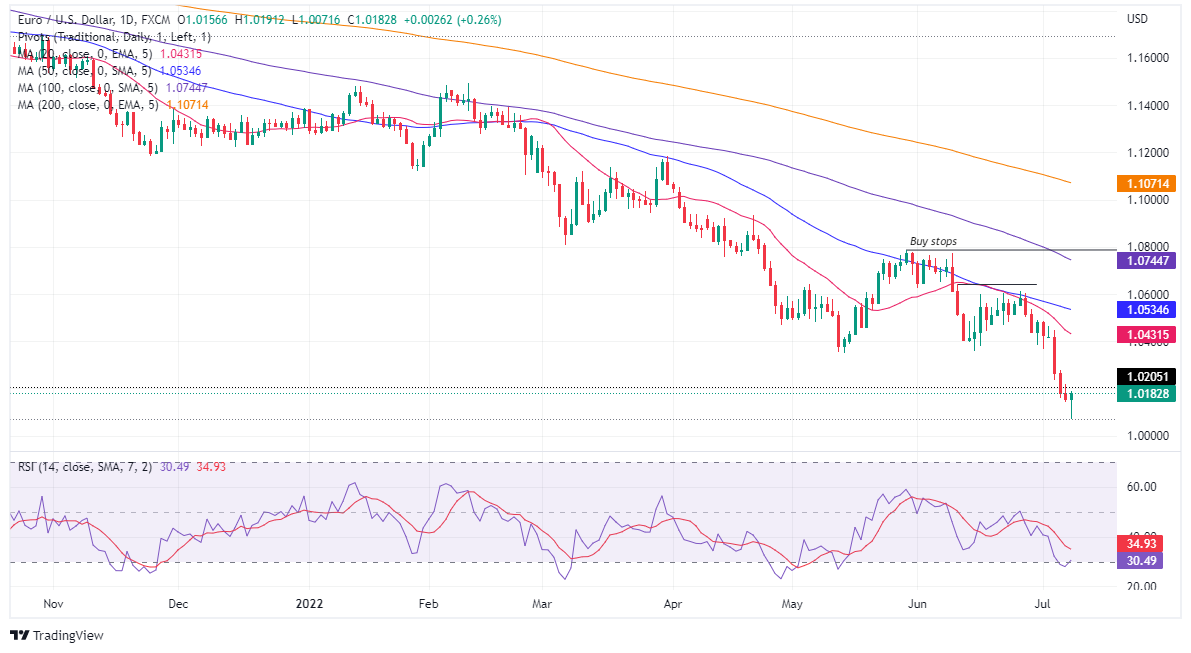
The EUR/USD is trading at 1.0182, having hit a fresh 20-year low at 1.0071 during the European session, though recovered after the release of the US Nonfarm Payrolls report, bouncing off late towards daily highs near 1.0190, before losing steam and settling at around current levels.
EUR/USD rallied despite solid US job report, EU’s energy crisis
Earlier in the North American session, the US Department of Labour reported that June’s Nonfarm Payrolls added 372K jobs to the economy, exceeding estimations of 268K. Average Hourly Earnings, and an indication of a wage-price spiral, remained contained at 5.1% YoY, above estimates, while the Unemployment rate prevailed unchanged at 3.6%. At the same time Fed speakers, namely Waller, Bullard, Bostic, and Williams, reiterated the case for a 75 bps rate hike to the Federal funds rate (FFR), while downplaying recession fears.
On the Eurozone side, ECB speakers remain vocal about hiking rates this month, and the consensus remained around a 25 bps rate hike. However, a 50 bps could be in play, but it is not the case scenario, as mentioned on its June minutes. Despite all that, the EU’s ongoing energy crisis hit the shared currency hard during the week, as the EUR/USD weekly chart illustrates the major is losing 2.47% in the week
Therefore, the EUR/USD path of least resistance is tilted to the downside, and a parity test is on the cards.
EUR/USD Price Analysis: Technical outlook
The EUR/USD daily chart indicates that sellers are in control, despite buyers’ effort to hold the fort around 1.0100. As the New York session waned, they achieved their task so far. However, oscillators like the Relative Strength Index (RS) exited oversold conditions, meaning sellers might be taking a breather before exerting additional pressure to drag prices lower.
Therefore, the EUR/USD first support would be 1.0100. Once cleared, the next support would be the current YTD low at 1.0071, followed by the EUR/USD parity at 1.0000. A decisive break would clear the way for September 2002 lows around 0.9608.

