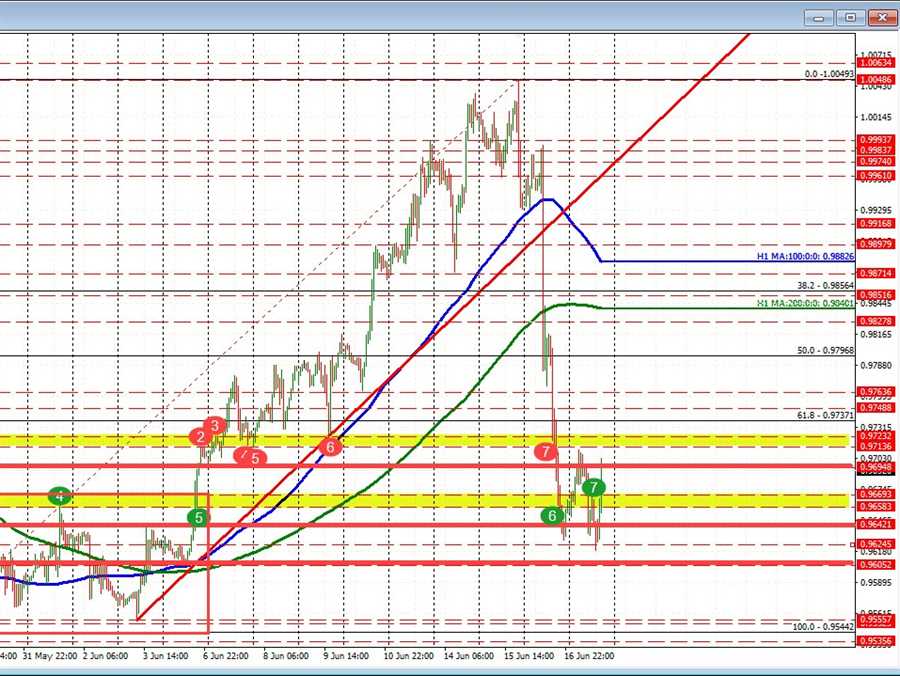
The USDCHF fell sharply yesterday after the surprise SNB hike of 50 basis points. The pair smashed through a number of technical levels including the 100 hour MA (blue line), 200 hour MA (green line), 50% retracement of the move up from the May 27 low at 0.97968, The 61.8% at 0.9737.
The price entered a low “extreme” area that confined the pair from May 23 to June 6th between 0.9544 and 0.9669.
Today, the price action has been up, down and back up as traders ponder “what now?”.
Does the USDCHF continue the selling to and through the lower May extreme? Or, does it further correct and see what resistance is above?
On the topside, the pair will is up testing a swing area between 0.9713 and 0.9723. A move above that area would have traders looking toward 0.9748 to 0.9763 and the 38.2% retracement of the move down this week at 0.97846 (not shown). All those targets would need to be broken on further upside momentum, in order to swing more of the bias to the upside.
Conversely, a move back into the red box consolidation extreme below the 0.96693 would reignite the idea of a retest of the lows from May at 0.9544.
Taking a broader look at the daily chart below, the ups and downs over the last 2 months looks like it favors a retest of the lows from May just because it would be more symmetrical (or at least testing the 50% retracement at 0.95774). A move below 50%, and the May low would have traders looking toward the 100 day moving average at 0.94845. That is also near a swing high area between 0.9459 and 0.9477.
From April 2021 until April 2022, the price of the USDCHF traded above and below its 100/200 day moving averages until finally basing against the 100 hour moving average on April 5 and starting a 29 day moved to the upside that took the price up 830 or so pips. That was followed by a 9 day run to the downside of about 520 pips. The the next 13 days took the price up 503 pips. Finally, the 3 day decline this week has seen 430 pips to the downside. That is a lot of volatility.
Volatility tends to beget volatility as it is a function of uncertainty, but change. The SNB hike in rates was a surprise and a catalyst for the move to the downside.

For now, watch the hourly chart targets for the short term clues. Extend above the upside target levels and ultimately through the 38.2% retracement, would give the buyers short-term control.
Fail and start to move back into the lower extreme from May, and the technical picture looks different.
