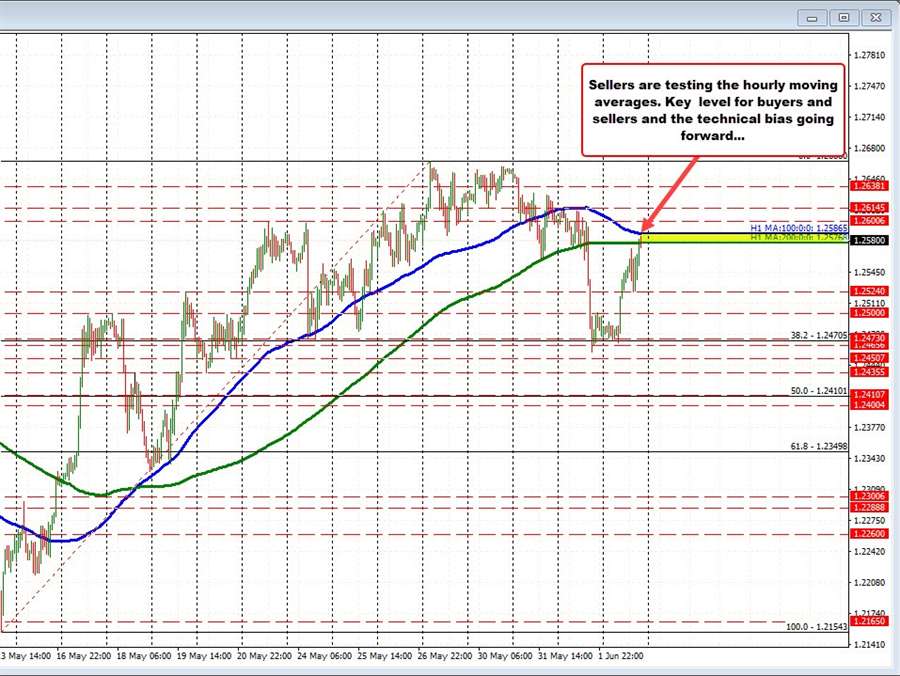
The GBPUSD is trading to a new session high and in the process is moving above its 200 hour moving average (green line in the chart above) at 1.25768 and testing its 100 hour moving average (blue line in the chart above) at 1.25865. Moving above both would increase the bullish bias from a technical perspective. Staying below keeps the sellers in play.
Recall from yesterday, the price traded between the 2 moving averages until cracking below the 200 hour MA at 1.2575 during the US session and running down toward the 38.2% retracement at 1.24705. The low price extended to 1.2458 before bouncing into the close. Today the low price stalled near the 1.24705 level before moving to the upside. The low price today reached 1.2468.
On the way higher, the GBPUSD price broke above 1.2500 and then 1.2524 (see chart above). The sellers leaned ahead of the the 200 hour moving average on the 1st try, and returned back to the 1.2524 level where dip buyers came in.
The current move higher extended through the 200 hour moving average but is finding sellers against the 100 hour moving average on the first look.
The area around the moving averages is key for both the buyers and sellers. A move above tilts the technical bias to the upside. Staying below will keep the sellers in play and could signal the end of the corrective move to the upside.
