- GBP/USD pares intraday gains as buyers struggle to keep reins at monthly high.
- 200-SMA, rising wedge’s support challenge bears amid market’s indecision.
- Firmer RSI, not overbought, hints at further upside towards recent top.
GBP/USD retreats from daily high as bulls take a breather around one-month top heading into Monday’s London open. Even so, the cable pair dribbles around 1.2650 of late.
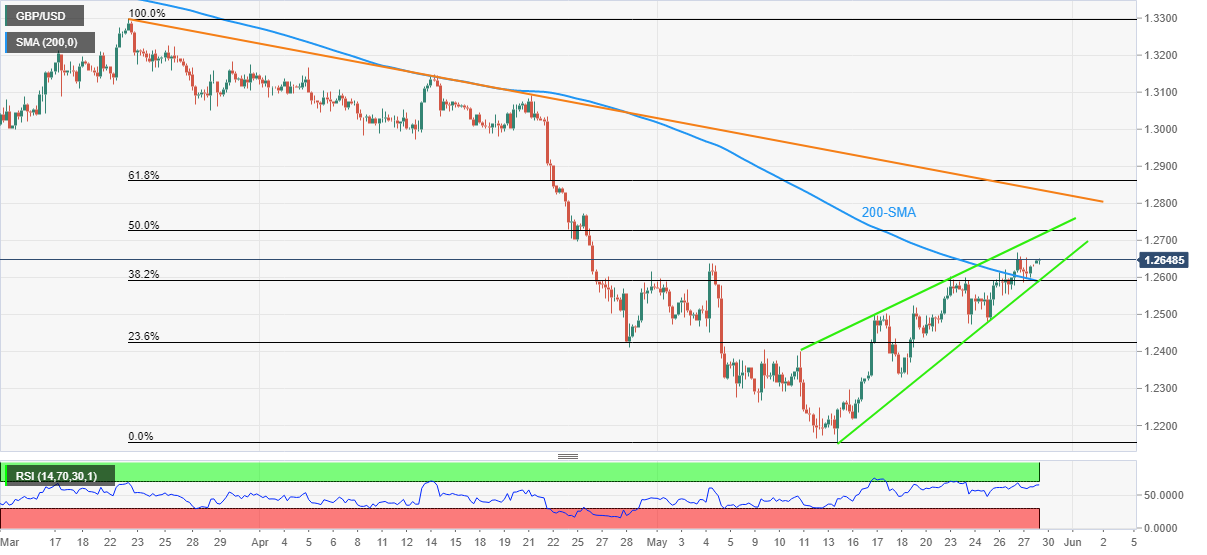
The quote remains inside a 13-day-old rising wedge bearish chart pattern. However, the firmer RSI (14) line, not overbought, hints at the pair’s further upside towards the stated bearish formation’s resistance line, at 1.2715.
That said, the recent peak of 1.2666 may also challenge the GBP/USD prices during the fresh run-up.
In a case where the quote rises past 1.2715, a downward sloping resistance line from late March, close to 1.2840, will be in focus.
Alternatively, pullback moves remain elusive until staying beyond the 1.2590 support confluence, including the 200-SMA and lower line of the stated wedge.
It’s worth noting, however, that a clear downside past 1.2590 theoretically opens the door for the GBP/USD fall towards refreshing the monthly low, currently around 1.2155.
During the anticipated slump, April’s low near 1.2410 may offer an intermediate halt.
GBP/USD: Four-hour chart
Trend: Limited upside expected

