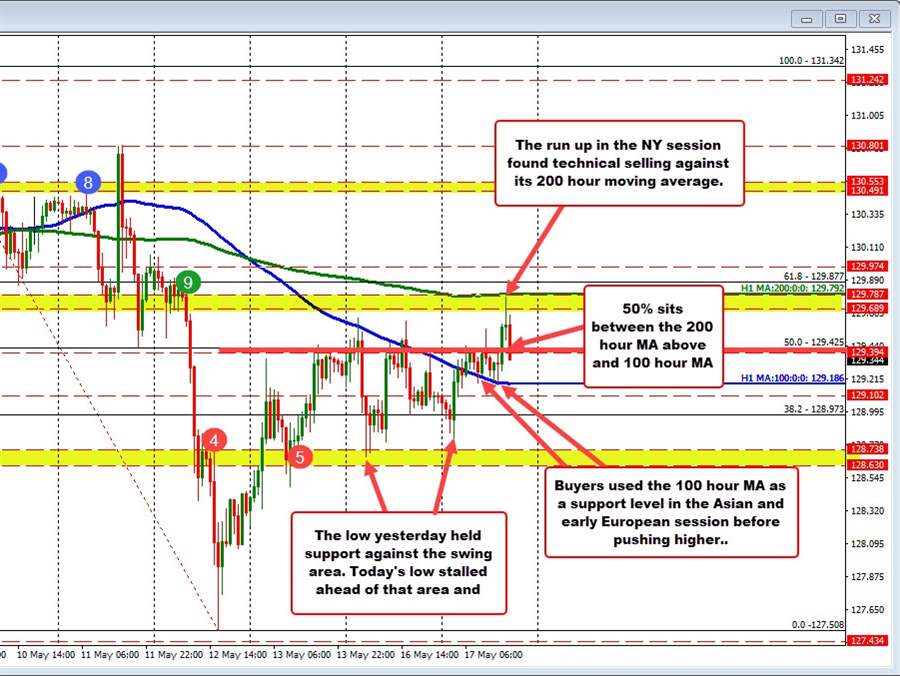
The USDJPY is moving up with the rise in yields, stronger stocks and overall dollar buying, but did run into some technical resistance which is balancing the move now..
Looking at the hourly chart, the price of the USDJPY moved above its 100 hour moving average (blue line in the chart above) in the Asian session and continue to hold support against that moving average level into the London morning session. That moving average currently comes in at 129.188.
The early North American session has seen a move to new session highs, and in the process the USDJPY price moved up to test its 200 hour moving average at 129.792 (green line in the chart above).
The price for the USDJPY reached 129.776 – just below that key 200 hour MA target – and backed off as traders leaned against technical level. The last time the price traded above the 200 hour moving average was back on May 11.
The current price is trading back down at 129.38. That is back below the 50% midpoint of the May trading range at 129.425.
What next?
With the 200 hour moving average defining upside resistance at 129.792, traders will eye the lower 100 hour moving average at 129.186 as support now.
In between sits the 50% midpoint 129.425. That could be an intraday barometer for buyers and sellers in the short-term.
On a break above the 200 hour moving average above, traders will eye the 130.00 level followed by a swing area between 130.49 and 130.553 (see blue numbered circles in the chart above)
Conversely on a break back below the 100 hour moving average, traders will look back down toward a swing area support between 128.63 and 128.738 (see red numbered circles).
Taking a broader look at the daily chart below, the USDJPY pair is consolidating near the cycle highs (the high price may was the highest price in over 20 years for the USDJPY), but above the 38.2% retracement of the last trend move higher.
Last week, the low price for the week stalled right near that retracement level at 127.495.
Ultimately, if the sellers are to take more control, getting below the 38.2% retracement is the minimum retracement target to get to and through. So far that minimum has been reached but not breached which from a longer term prospective, keeps the sellers nervous and the buyers in control.

