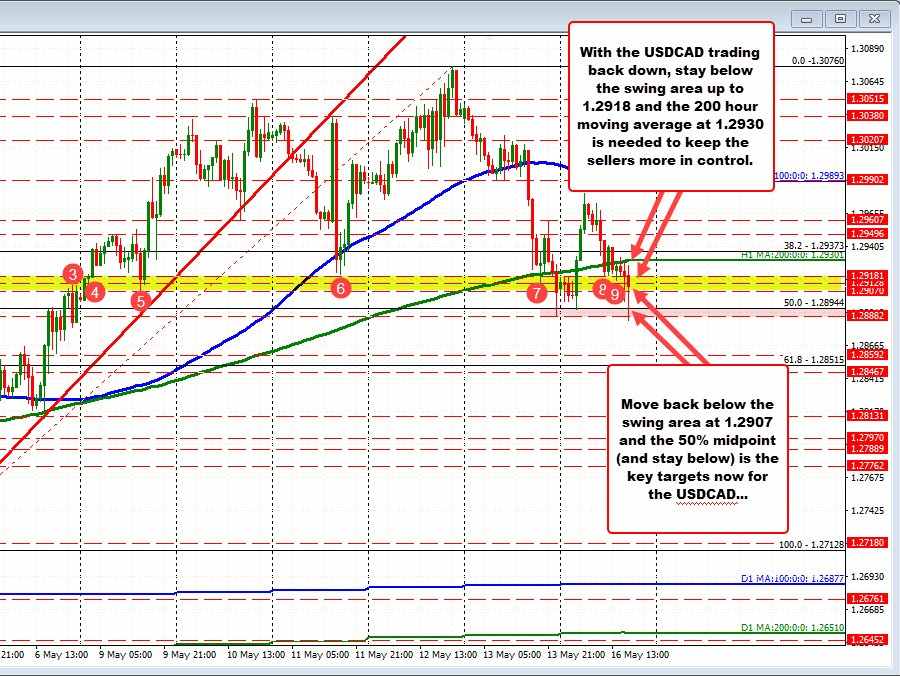
The USDCAD has moved to the lowest level since May 6th in the current hourly bar. The new low moved below the low from Friday at 1.28882. The low price reached 1.28857, but has already bounced and currently trades back above the 1.2900 level at 1.2913 currently
The move to a new low also took out the earlier Asian session low of 1.2894. That low in the Asian session led to a rally up to 1.29805 before rotating back to the downside in the European and early New York session.
What now ?
Looking at the hourly chart, the USDCAD price move to the downside has taken the price back below the 200 hour moving average at 1.29301 (green line in the chart above). It is also moved below a swing area between 1.2907 and 1.29181 (see red numbered circles in the chart above). Traders will now use that area as resistance. Stay below and the bears have the short-term edge. Move above and all bets are off for the downside.
Having said that, getting back below the 50% and the low from Friday and today is needed to give the sellers more confidence. So far on Friday and again today there has been brief breaks below the 50% midpoint of the range since May 5. That’s okay, but getting and staying below the midpoint is important inflection point for buyers and sellers.
So watch 1.2918 and the 200 hour moving average 1.29301 on the topside. On the downside, move below 1.2907 and the 50% midpoint at 1.28944 would likely be enough to give the sellers more confidence, but the price as to stay below the 50% to keep that confidence intact..
