It’s a brutal backdrop in markets with stocks down 5 weeks including nearly 20% drop in the Nasdaq.
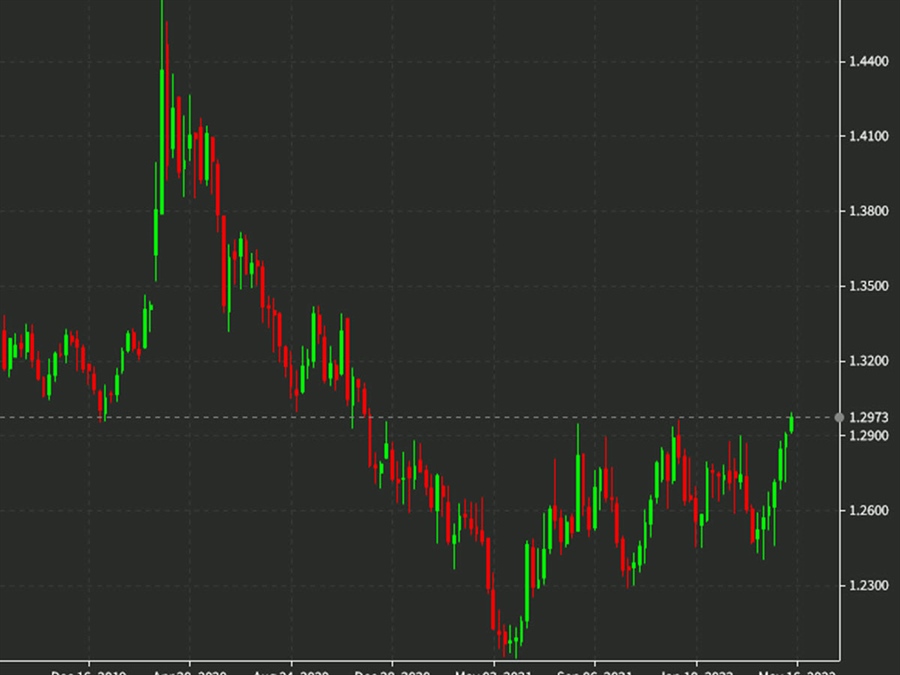
Yet when you look at a chart like this, it looks like it could get much worse.
USD/CAD has been consolidating in the 1.23-1.29 range since August but may be breaking out to the upside today. It will need to close above 1.30 to confirm it but the measured target would be around 1.36.
That’s a number I talked with BNNBloomberg about two weeks ago.
As I said in that video, the focus in markets has moved to growth. Inflation and rate differentials were the trade before but now growth worries are dominating. Every day that China stays in lockdown adds to supply chain risks as well.
I’m starting to think about the next trade after this one as well.
The problem for this decade for commodities is the lack of investment in supply. If we have a growth scare and a rout in markets, the much-needed decisions on new projects will be deferred for another year. That will exacerbate supply shortages down the line.
Eventually China will reopen and eventually Fed rates will top out. When that happens, there aren’t going to be enough raw materials to go around. Ultimately that will benefit things like oil and copper along with the resource-heavy Canadian economy.
The question now is how to time that trade. I don’t see any rush.
