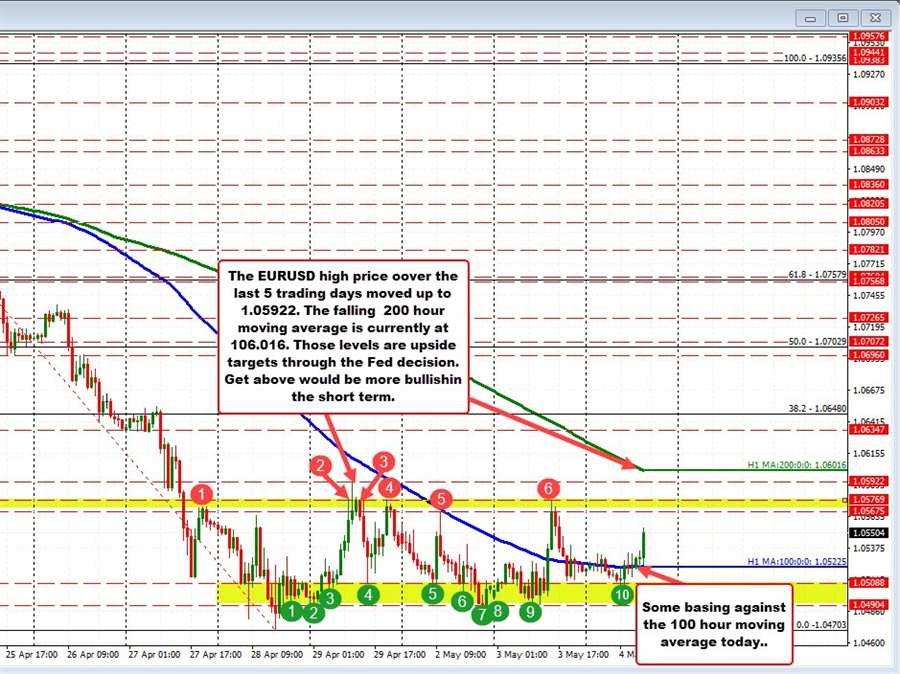
The EURUSD traded in a narrow 29 pip range as North American traders entered for the day. The price action on the hourly chart above saw the pair trading above and below its flattening 100 hour moving average. That range has now been extended to the upside (up to 50 pips now) and with it, the price is moving away from the MA levels.
The last 5 or so days of trading in the EURUSD has seen up and down trading between 1.04703 on the downside and 1.05922 on the topside (122 pips). For the current week, the range is only 87 pips (halfway through the trading week). That has allowed the 100 hour moving average to catch up to the price (see blue line)..
Yesterday, traders took the price above the 100 hour moving average for the 1st time since April 22. However the price rise stalled ahead of the Friday high up at 1.05922. The high price could only reach 1.05769 before moving back to the downside. There have been a number of swing highs over the last 6 trading days between 1.05675 and 1.05769 (see red numbered circles and yellow area in the chart above). Going forward getting above that swing area and the falling 200 hour moving average currently at 1.0600 would increase the bullish bias for the pair. The price has not traded above its 200 hour moving average since April 22.
Conversely, moving back below the 100 hour moving average (blue line) would tilt the bias back to the downside in the short-term. The lows from Monday and Tuesday near 1.0490 and the low from last week at 1.04703 would be the obvious next targets on further weakness. The 1.04703 level was the lowest level since January 2017.
Yesterday ECB’s Schnabel said that a rate hike could come as early as July. The market knows that the US is on a tightening bias. The question is “Has the dynamics of higher US rates been priced into the market?” and “Does ECB tightening – perhaps a little earlier than expected – change the dynamics in the short-term for the EURUSD?”.
It is hard to quantify that hence the importance of of following the technicals. In the short-term, the price of the EURUSD staying above the 100 hour moving average is a positive (short term risk for buyers). Getting above the 200 hour moving average would be the next step in a progression to the upside. From there, other upside targets include the 38.2% retracement of the last move down at 1.0648. Getting above that retracement would be another example of the market’s willingness to at least probe higher after the sharp fall in this currency pair.
The high for the year for the EURUSD ‘s high was in February 10 at 1.1494. The move to the low at 1.0470 represented a 1424 pip decline from the high to low or -12.38%. That is a significant fall in a relatively short period of time. Nevertheless, the technicals have to support the declines. They become the barometer for the buyers and sellers going forward.
