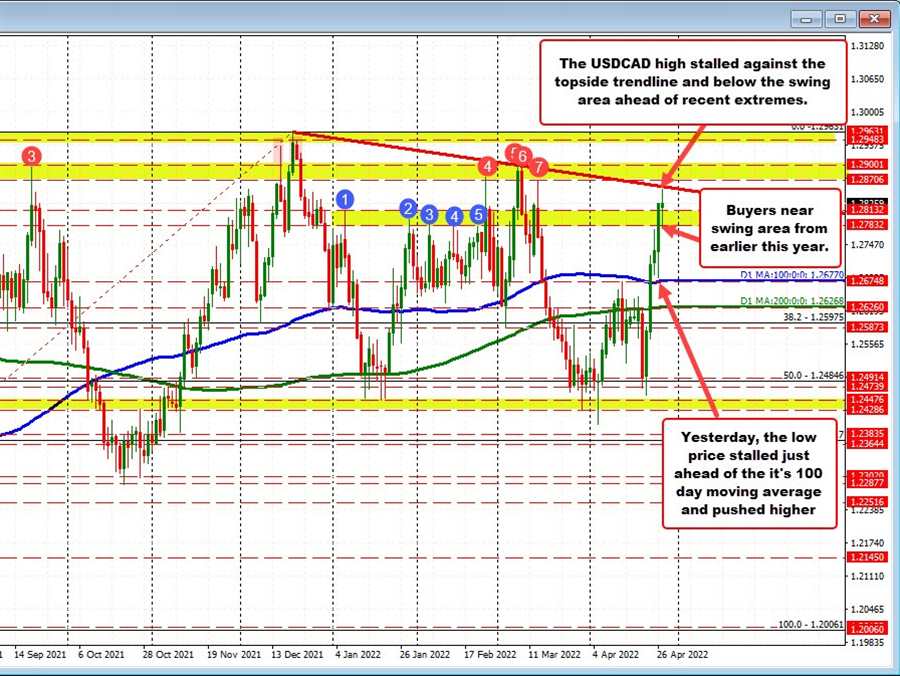
Admittedly, the USDCAD daily chart is a thing of choppiness. There are plenty of up and down moves going all the way back to November and December 2020. While the US dollar is making multiyear highs against a number of currencies, the pair remains within the up and down extremes although nearer the highs.
Looking at the daily chart above, near the highs, there is a swing area between 1.28706 and 1.2900. That area comes ahead of four other extremes at the price up to the highs near 1.2948 and 1.2963.
In trading today, the price continued its run higher. Recall from yesterday, the low price stalled right near it’s 100 day moving average (blue line in the chart above – bullish) and moved sharply to the upside. The move higher today stalled just ahead of a downward sloping trendline at 1.2858. The high price reached 1.2953. Those levels were ahead of the aforementioned swing area between 1.28706 and 1.2900.
On the downside today, the price low stalled near another swing area on the daily (see blue numbered circles)
What next?
Today’s range was defined by the closest technical levels on the daily chart. They will remain the targets to get to and through.
On the topside, get above the trendline and the swing area up to 1.2900, and traders will likely make a run toward the swing highs going all the way back to November and December 2020 near 1.29631.
Fail to get above those levels, and move below the 1.2783 level, and we could see a rotation back toward the 100 day moving average 1.2677.

 RULE-BASED Pocket Option Strategy That Actually Works | Live Trading