The GBPUSD is following the trend of the USD moving higher. US yields have pushed to the upside with the two year now up eight basis points to 2.435%, and the 10 year up 7.7 basis points to 2.781%. It is well off the low levels for the day at 2.301% and 2.648% respectively. The move higher in yields and pushed gold down close to $10 or -0.5%. US stocks have also retreated with the NASDAQ index down near -1% on the day.
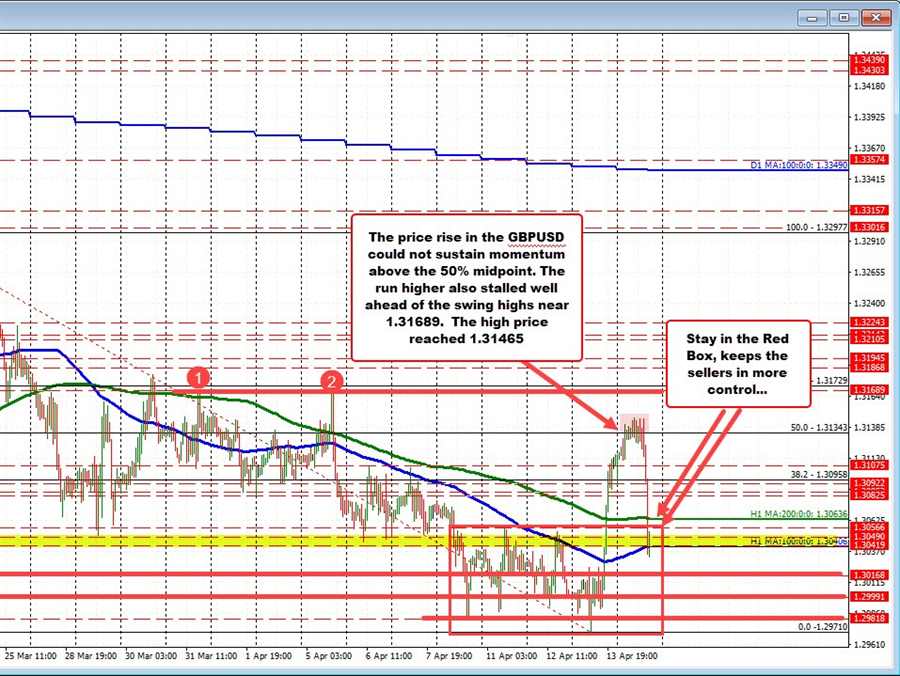
Looking at the GBPUSD hourly chart, the pair has moved back below its 200 hour moving average at 1.30636. The price also briefly moved below its 100 hour moving average at 1.30406, but has since moved just above that level. The low for the day reached 1.30324. There is some stall around the 100 hour moving average as sellers and buyers ponder the next move.
Yesterday, the pair traded sharply higher and in the process broke above both the 100 and 200 hour moving averages with momentum. That led to increased buying in the Asian session today with the price moving above the 50% midpoint of the move down from the most recent swing high on April 23. That level came in at 1.31343. However the price could not approach the swing highs from March 31 and April 5 near 1.31689. The high price reached 1.30465.
The EURUSDs move lower on less hawkish ECB, and pretty good retail sales data in the US started to send the yields higher in the US and the USD higher in the process.
What next?
The trading range for most of Friday until the New York session yesterday saw the GBPUSD trade between 1.2971 then 1.30566. The pair has reentered that range (see red box in the chart above).
Of note from the recent price action is that the high price – since reaching below the 100 hour moving average – has been limited to 1.3053 – just below the high of that trading range (see red box). If the price can remain below that upper extreme from the Red Box at 1.30566 (and the 200 hour MA), the downside is favored once again.
The choppy price action within the red box earlier this week could beget more choppy price action as the pair moves lower.
Keep an eye on 1.30168, 1.3000 and 1.29818 ahead of the swing low from yesterday’s trade at 1.29714 short-term clues on a further journey to the downside. I know there are a lot of levels fairly close together, but they would help define the downside roadmap and targets.
Alternatively, if the price were to start to move outside of the red box to the upside at 1.30566, and extend above the 200 hour moving average at 1.30636, the sellers tried but failed on the the momentum move toward hourly moving average levels. The sellers could easily switch back to buyers and push price back toward the 38.2% retracement 1.30958 if the failure occurs.
I know one day could be positive next day negative and the next day choppy up-and-down, but overall, technical levels did form a roadmap for strength yesterday, and reversed that roadmap today with the bears/ taking back more control after upside targets failed and/or could not be reached.
