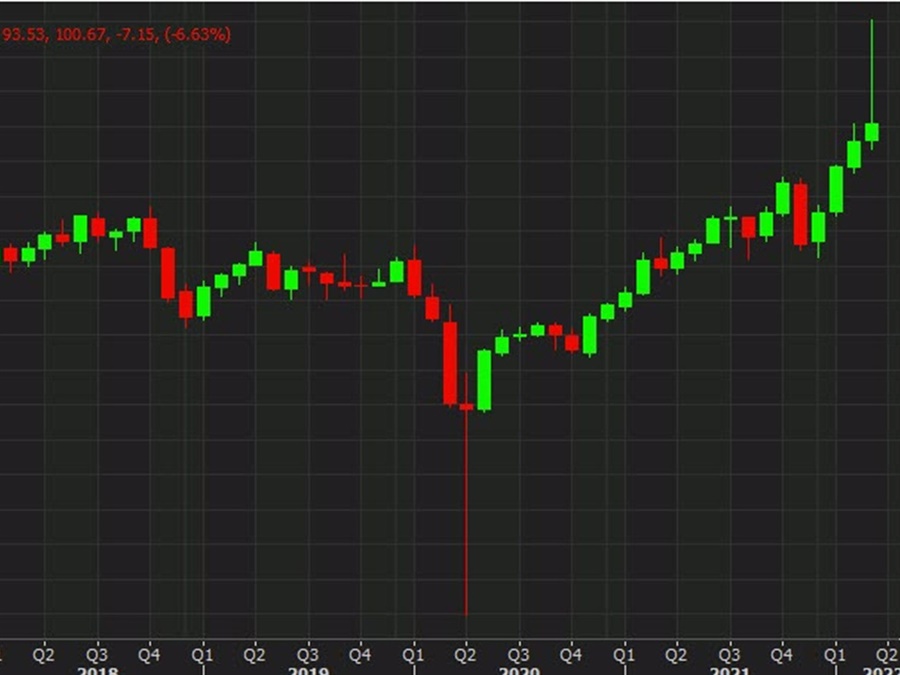

I’m not going to draw any fancy lines on the chart but a glance at the monthly oil chart stands out because of the looming mirror image from April 2020, when prices went deeply negative only to leave a largely unchanged candle.
This time it’s a different geopolitical event but much of the same look with prices finishing the month about where they started in trading that was nearly as volatile. Today, WTI crude oil fell $7.17 to $100.69 after briefly cracking $100.
If we see a deeper retracement it will likely be due to covid once again. Shanghai extended its lockdown today for another 10 days and expanded it to new parts of the city. Nationwide there were more than 8000 new covid cases in China and President Xi this week doubled down on the policy of ‘dynamic covid zero’.
If lockdowns were to grow more widespread it could badly sap demand for crude among China’s 1.4 billion people.
Biden also announced the releases of 180 million barrels from the SPR today in a move that could help to balance the market in the short term.
A final factor to watch is Iran and a potential nuclear deal. At times it has looked extremely close but the latest signals have been more mixed.