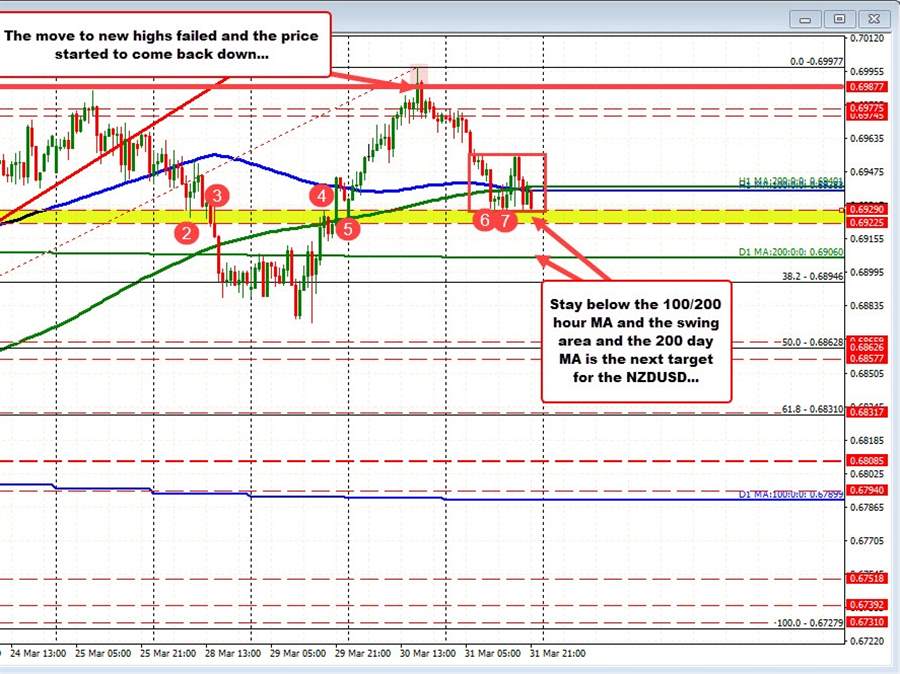
The NZDUSD has been trading above and below its near converged 100/200 hour MAs at 0.6938 area. The current price is trading at 0.6930 – below those two key moving average levels.
However, adding some caution is that the price has been trading above and below those MAs over the last 10-11 trading hours after the sharp move lower in the Asian session and into the European session. The lows for the day have found support against a swing area between 0.6922 and 0.6929 (see red numbered circles).
A move below that area now is needed to have traders looking toward the 200 day MA at 0.6906.
What helped the run lower today?
Looking at the daily chart below, yesterday the price reached up to a new 2022 high of 0.69977. That move took the price to the highest level since November 22, 2021. However, at the high, the price tested the 50% of the move down from the 2021 high to the 2022 low. That midpoint level comes in at 0.69966 – just below the high price at 0.69977 from yesterday (see daily chart below).
Traders leaned against the level.
The price decline today was helped by that midpoint level holding. Now traders have to decide if the move off the high can extend the declines. Get below the 0.6922 level and then the 200 day MA at 0.6906 and the door would be further opened. Absent that, and the buyers are not done yet.


 RULE-BASED Pocket Option Strategy That Actually Works | Live Trading
 This “NEW CONCEPT” Trading Strategy Prints Money!… (INSANE Results!)