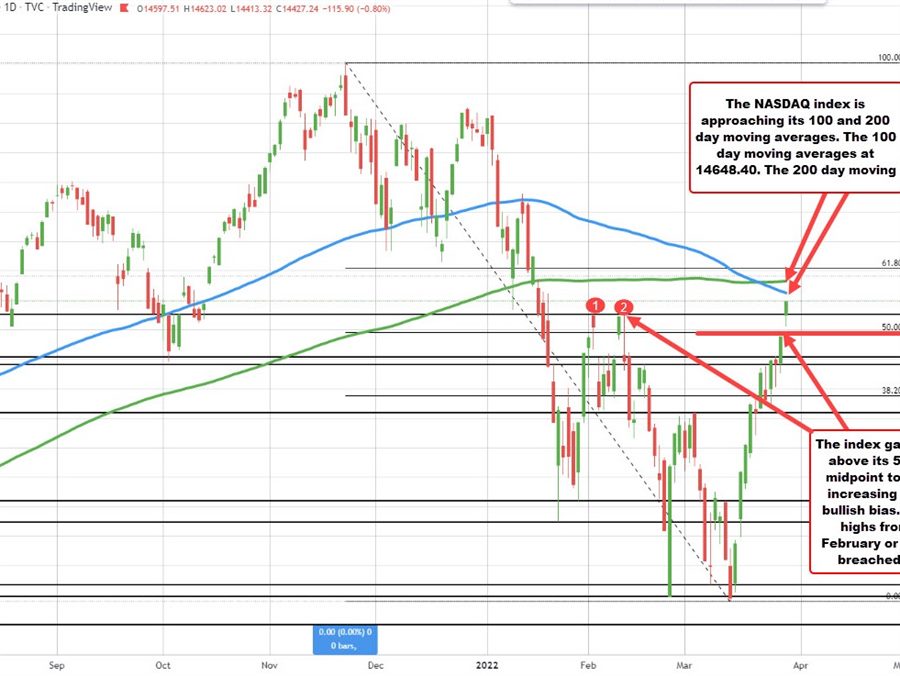
The Nasdaq index is currently trading up 234 points or 1.63% at 14500. The high price reached 14591 so far. The index is working on its eight day higher in 11 trading days. Since bottoming on March 14, the index is up over 16%. The index is still 11.22% away from its all-time high reached on November 22.
Technically, the move to the upside today took the price above the 50% retracement of the move down from the November high at 14383.79. That will now be a risk level for longs looking for more upside. Stay above is more bullish.
The move higher has also taken the price above swing highs from February at 14504 area. That is a closer risk level.
The next key targets on the topside would have the pairs moving back above the 100 and 200 day MAs. The 100 day MA currently comes in at 14648.21. The 200 day moving average is modestly above that level at 14726.65. Move above each would increase the bullish bias from a technical perspective. However, I would expect that traders give cause for pause against the levels on the first look, with stops on a break above.

 RULE-BASED Pocket Option Strategy That Actually Works | Live Trading
 This “NEW CONCEPT” Trading Strategy Prints Money!… (INSANE Results!)