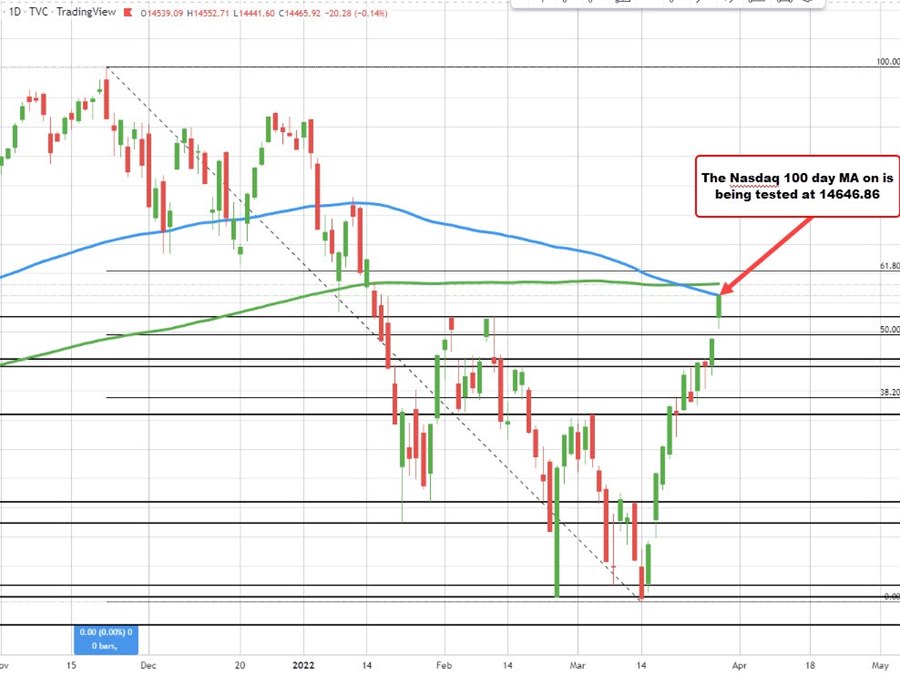
It did not take long to reach the key target outlined in an earlier post, but the NASDAQ index has reached its 100 day moving average at 14648.86. The high price just reached 14646.90. Above the 100 day moving averages the 200 day moving average at 14726.96. It would take a move above both to increase the bullish bias, but so far, the sellers are leaning with 20 minutes left to go in the trading day.

This article was originally published by Forexlive.com. Read the original article here.