
The USDCAD moved sharply lower yesterday and fell for the 3rd day in a row. The pairs move to the downside, was able to extend back below the low from last Friday after the stronger than expected jobs report validated the BOC decision to raise rates at it’s most recent meeting.
Technically, the pair moved away from its 100 day MA at 1.25832 in the North American session and close near the low for the day and just above its 200 day MA (at 1.2604 today).
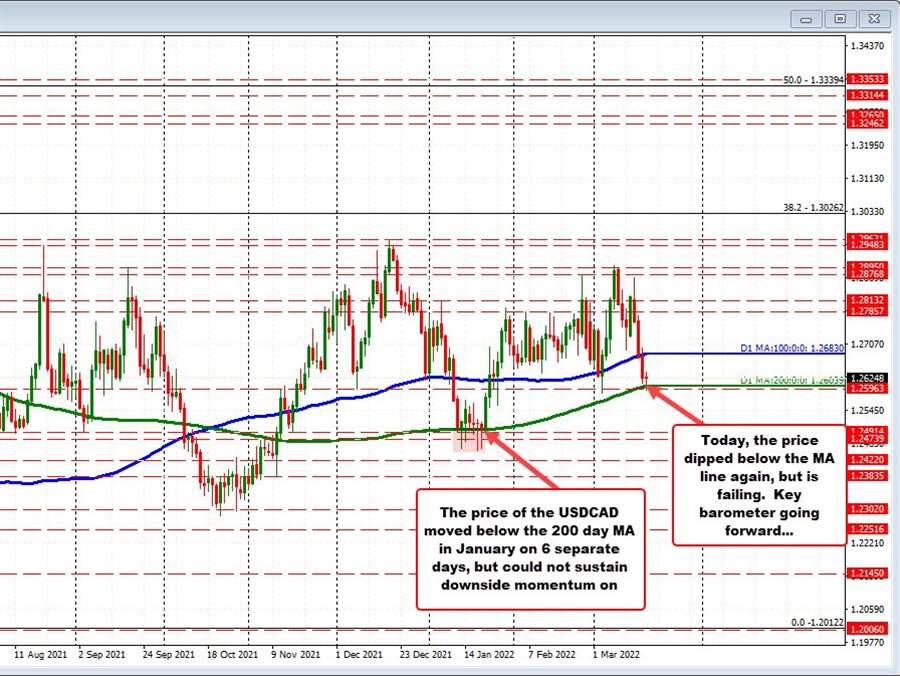
In trading today, the price did make it’s way below the 200 day MA for the first time since January 20 (see daily chart below). The price in January fell below that MA on 6 separate daily bars, but close at or above the MA line on each of those breaches.
Is today’s move a continuation of that pattern?

Looking at the hourly chart, the move to the upside needs to get back above the 1.2645 (swing low from March 3) and 1.2656 (swing low from Feb 28) to give more comfort to the buyers.
Conversely, a move back below the 200 day MA would not be a great development technically.
The pair is in a narrow 44 pip trading range today with the 22 day average at 99 pips. So there is room to roam outside the current trading range if there is a break (in either direction).