- TSLA drops nearly 5% on Friday as macro factors in charge.
- All EV stocks LCID, Chinese names suffer the same fate.
- Tesla once again is targetting its 200-day moving average.
Tesla (TSLA) followed many EV names (all, if we are correct) lower on Friday as macro factors took charge over equity markets. The dominant theme so far in 2022 has been one of rising rates and inflationary pressures. This has led to high growth and tech names underperforming, while energy and financial stocks have been the place to be. That is likely to remain the theme for at least the next quarter if not also Q2.
Russia and Ukraine tensions have pushed the oil price above $90, and financial stocks benefit from higher interest rates. Growth stocks, however, do not benefit from higher interest rates as investors look for businesses with cash. With higher interest rates, future cash flows become less valuable. So of the three names mentioned, Tesla, Rivian (RIVN) or Lucid (LCID), we would not want to currently be long any of them. We expect TSLA to perform best of the three due to its market-leading position and revenue, but this sector is out of favour and likely to remain so.
Tesla Stock News
The latest data from the China Passenger Car Association (CPCA) confirms what we saw from Chinese EV companies earlier. Deliveries for January were down versus December. This is due to the lunar new year in China. Tesla sold 59,845 vehicles in January, down from 70,847 China-made vehicles in December. The Chinese electric vehicle market remains the largest EV market in the world, helped by government incentives and population demand.
Tesla Stock Forecast
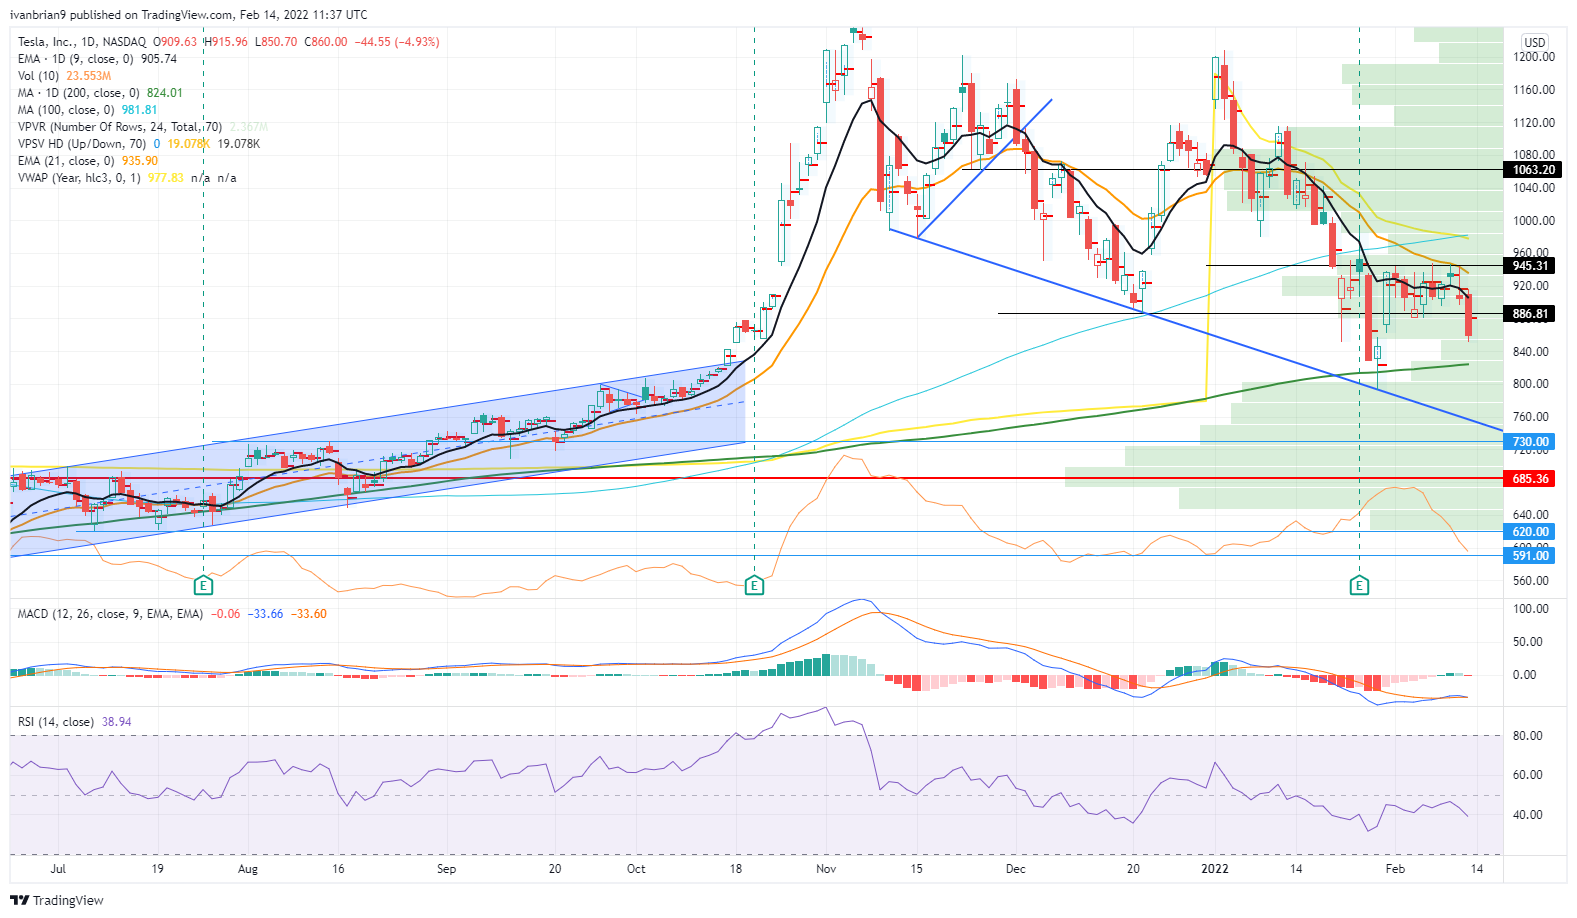
Tesla remains in the strong downtrend identified earlier this year. $945 was tested multiple times as resistance and failed. This has resulted in the recent pullback. Now $824 remains as the 200-day moving average. Below we have trendline support at $752. The 200-day is the key level. Tesla has not closed below its 200-day moving average since June 2021. It has broken the 200-day on an intraday basis several times since but always failed to close below. Notice how volume has steadily been declining in Tesla this month, despite some hugely volatile days. This is indicative of a lack of conviction in the stock.
Tesla (TSLA) chart, daily
Like this article? Help us with some feedback by answering this survey:

