The major US indices are continuing the move to the downside with the NASDAQ down over 200 points. The S&P index is down around 40 points.
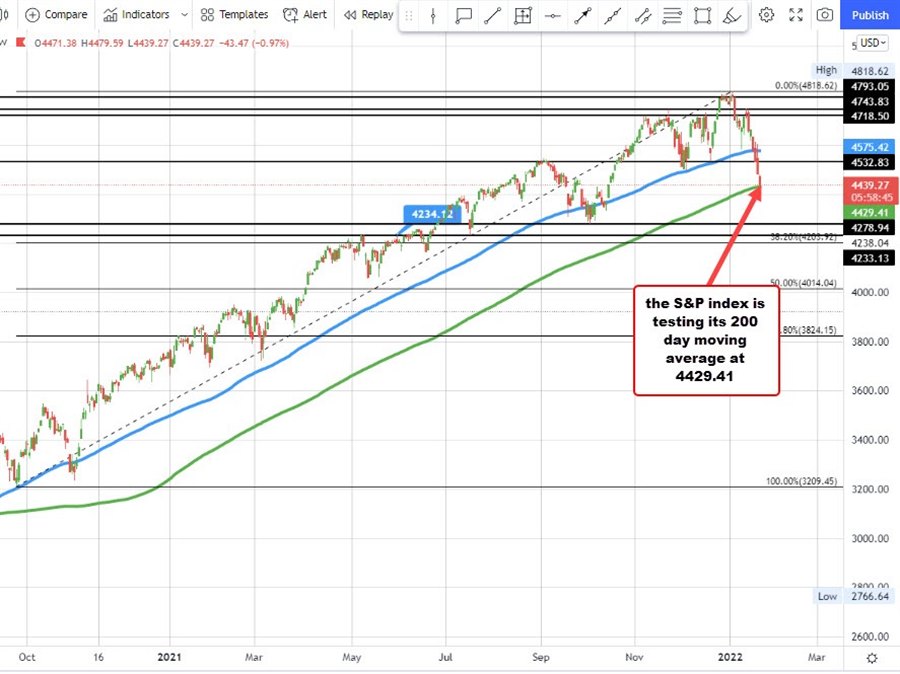
Looking at the S&P daily chart, is approaching its 200 day moving average. That level comes in at 4429.41. The low price today reached 4437.25 (the price is currently trading at the low).

Both the Dow industrial average and the NASDAQ index have already move below their 200 day moving averages.
The Dow industrial average’s 200 hour moving average comes in at 34952.40. The current price is at 34597.
The NASDAQ 200 day moving average is up at 14736.66. The current price is at 13953. The NASDAQ has now closed below the 200 day moving average for three consecutive days and working on its fourth (5 of the last 6 days).