Stocks rotate back to the downside

Technical Analysis

The Dow and S&P are trading at session lows. With the declines, the S&P is now more comfortably below its 100 day moving average of 4576.85. The current price is trading at 4560, down 16.88 points or -0.37%.

S&P index

S&P index is trading below its 100 day moving average

Meanwhile the Dow industrial average is also below its 100 day moving average at 35412.12. The 200 day moving averages at 34953.39. Back in early December, the price move below that moving average for one day before rotating back to the upside.

Dow industrial average

Dow is trading below its 100 day moving average

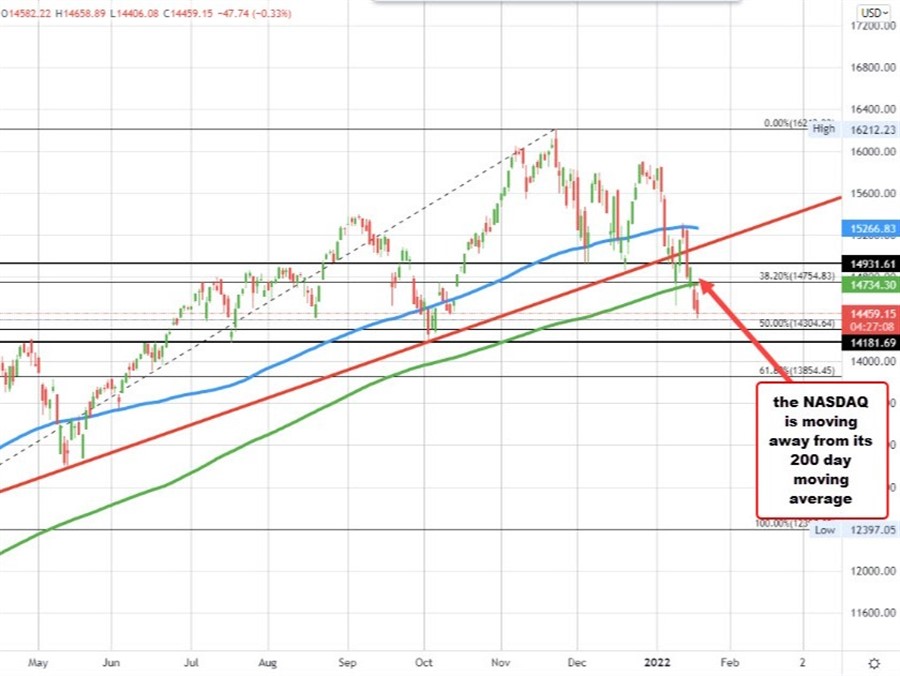
The NASDAQ index meanwhile is moving away from its 200 day moving average at 14734. Today would be the second consecutive close below that key longer-term moving average.

NASDAQ

NASDAQ moving away from its 200 day moving average

Articles You May Like

Block shares plunge 17%, head for worst day in 5 years after earnings miss
USDCHF moves toward low of trading range since mid-December
Gold Price Today: Yellow metal prices flat, silver up by Rs 1,300/kg
Coinbase revenue surges more than 130%, driven by postelection crypto rally
France January final HICP +1.8% vs +1.8% y/y prelim

Leave a Reply

Your email address will not be published. Required fields are marked *