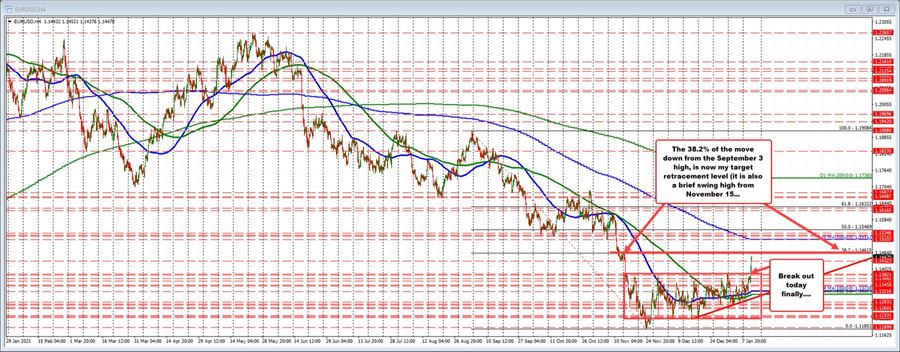
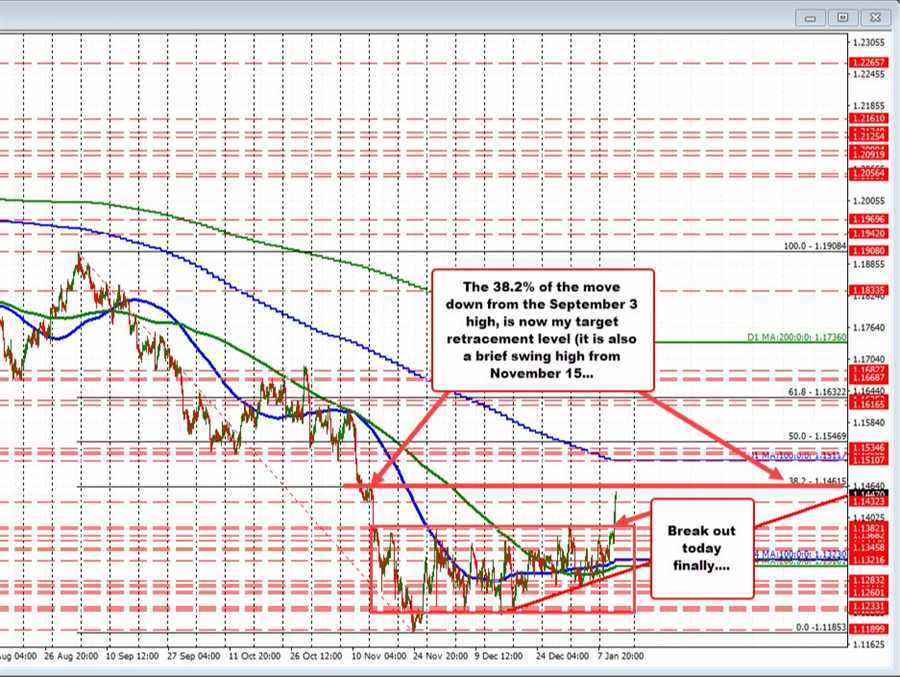
In an earlier post(s), I was targeting the 50% of the move down from the October 28 high. That was the corrective high from that day and started the sharp move to the downside that bottomed on November 24th. The midpoint was at 1.14385 (see last post here). The price has reached that target and is now above it, rising to a new high at 1.14521
Why use the lower retracement?
The market trend move down has actually taken trend steps lower. Those steps matter in measuring retracements. Moreover, it gives traders a closer target to shoot for vs. a target that is really out of reach.
With the move above the 50% of the lower range, the bias has now tipped to the “other side” of that trend leg lower. Hence, it is time to find the next retracement targets from a higher high.

So…looking at the 4-hour chart above, that 50% midpoint was of the last – most recent – leg lower. It came after a consolidation period after a move down from a higher high from September 3 at 1.19084.
Moving the retracement tool to that high (i.e., the September 3rd high), spreads the retracement target out. The 38.2% of the trend move down from the September 3, 2021 high cuts across at 1.14615. That is now the next target. It also corresponds with a corrective high from November 15.
Having measured that out, the September high is not even the highest high. It represent another interim high . The real high price – and start of the trend move lower from 2021 – was at 1.22656 back on May 25th.
The point is, when measuring retracements, I think the market needs to take bigger moves in steps.
- The 50% of the last trend move lower is one retracement.
- The next higher high from September 3 swing high, targets another retracement, and should the rally continue even higher,
- I will look to target the 38.2% of the move down from the May 25 high. That high was the “real” high of the most recent cycle trend move lower from 1.22657 to 1.11853.
For now though, get above the 38.2% of the move down from the September 3 high is the focus, and then traders can focus on the 50% of the same move lower at 1.15469. Once above those, it will be time to move the high up to the May 25 high.
