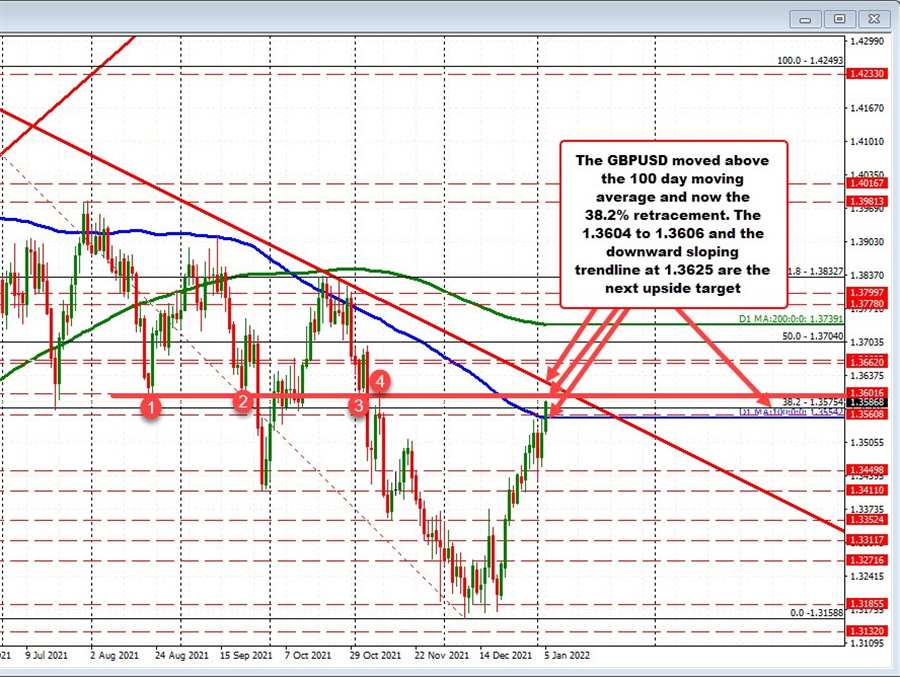

The GBPUSD cracked above its 100 day moving average at 1.3554 earlier today, and has more recently broken above the 38.2% retracement of the move down from the June 1 high at 1.35754.
The next targets in the progression off the daily chart (see earlier post) come in against the swing high from November 9 at 1.3606, the swing low from November 2 at 1.36046 and a swing low going back to March 20 at 1.3605. Move above those levels and traders would target the downward sloping trendline which cuts across near the 1.3625 level currently.
With the breaking of the 100 day moving average, that moving average is now a risk defining level off the daily chart. Move back below and the bias returns back to the downside. Note that in October, the price had seven different moves above its 100 day moving average without much momentum on the breaks.
That does not mean that this break will fail, but traders will be on the lookout and defining risk/bias against the moving average line once again.