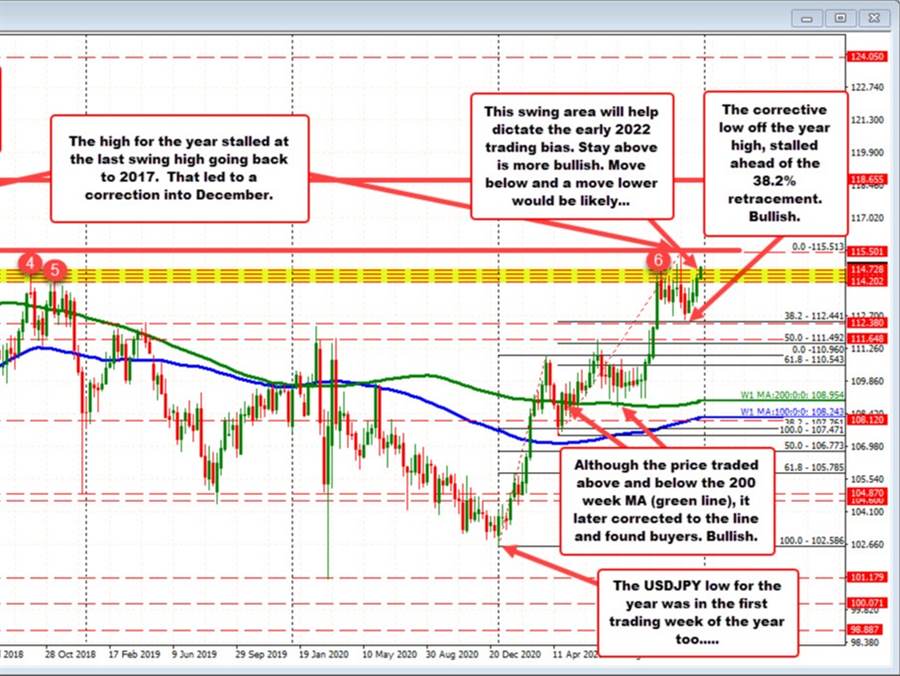
The year 2021 for the USDJPY can be characterized as a trend like move higher.
The USDJPY pair had it’s low for the year on January 6th (the first week of the trading year) at 102.586. The high for the year (with a few days left to go) peaked at 115.513 on November 24. The current price is trading higher today at 114.86 – just 65 pips from the 2021 high.
The low to high trading range totaled 1292 pips. which compares favorably vs. the last 5 years
- 2020 range was 1106 pips
- 2019 range was 795 pips
- 2018 was 996 pips
- 2017 was 1124 pips
- 2016 had the largest range of about 2275 pips
As far as the price action, the pair trended higher to the March 31 high to 110.96 (836 pips), corrected about 349 pips to 107.47 on April 23, before spending the rest of the year, consolidating sideways until moving higher in the second half of September until topping out at 115.513 toward the end of November.
Technically, the run up into March, saw the pair move above and 100 and 200 week MAs (blue and green lines). The correction in April, saw the price correct back below the higher 200 week MA (green line), but remain above the 100 week MA (blue line). Bullish.
The 38.2% of the move up from the January low, was briefly broken at the April 23 low, but move back above that line the following week. The pair waffled above and below the 200 week MA before breaking higher toward the end of May.
Key for the technical traders was the support buyers against the 200 week MA line in early August. Finding buyers against that MA line (even though the price was initially not running higher until the week of September 19), kept the buyers more in control.
The run higher did find willing sellers against a swing area between 114.20 to 114.728 initially (swing highs going back to April 2017 – see red numbered circles), before breaking higher toward the end of November. The high in November stalled right near the swing high going all the way back to March 2017 (the closest swing high going back in time). That level was the next target on the topside, and sellers leaned. The price moved back below the swing area on the profit taking.
The subsequent and final correction of the move higher from the April 23 low did stall just ahead of the 38.2% at 112.441. That helped to keep the buyers in control. Bullish.
The price over the last 4 or so weeks has resumed the move back to the upside.
What next?
The price today is retrying life above the high of that swing area at 114.728. Staying above could lead be another run to the upside before year end. Its is only 65 or so pips away.
Get above 115.51 and the door will open for a run toward the 118.655 area in early 2022, where the next major swing highs from the weeks of December 11, 2016 and January 8, 2017 peaked.
What would hurt the bullish bias?
Falling back below the 114.202 would disappoint the buyers looking for a continuation of the trend higher. Moving below would not necessarily ruin the buyers control, but it would weaken their technical hand and could lead toward a fall back toward the 38.2% level at 112.441. Fall below that level and the sellers will start to wrestle more control from the buyers.
Overall for 2021, it was a buy the USDJPY year. Longer term technical levels like the 100/ 200 week MAs came into play. There was a period where the pair consolidated in an up and down in a trading range, but holding the 200 week MA, kept the buyers in control and ultimately helped pave the way for the end of year run higher and a bullish bias into 2022.


 This “NEW CONCEPT” Trading Strategy Prints Money!… (INSANE Results!)