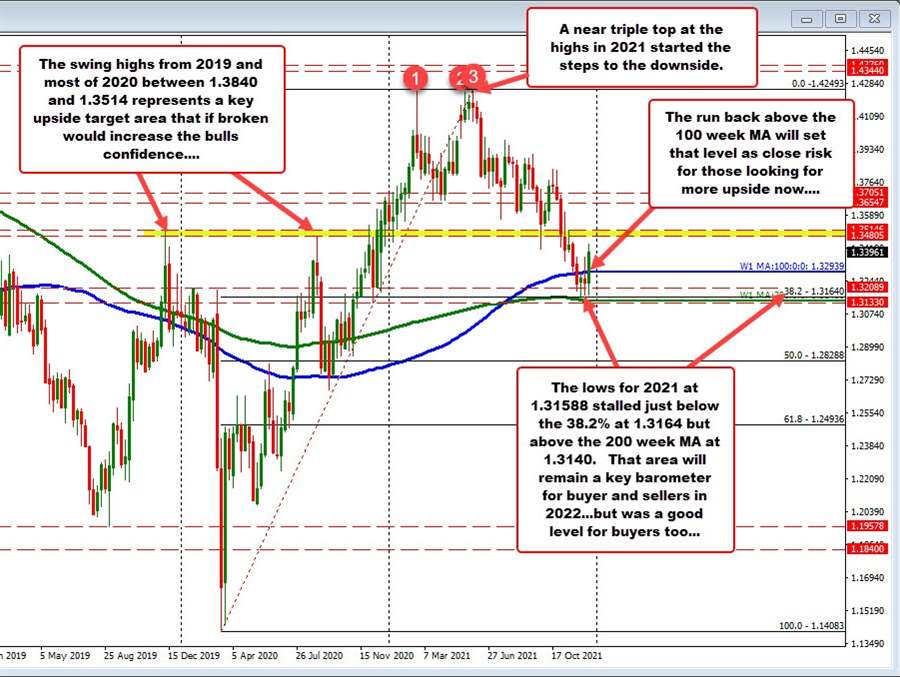
The GBPUSD closed the 2020 year at 1.3662, and spent the first 37 trading days working its way to the upside. A swing high was reached on February 24 at 1.4240 (578 pip from the year end close), before correcting down to 1.3668 at the end of March and early April – just above the close for the year (at 1.3662).
From there, the price moved back toward the high for the year, surpassing the February high at 1.4240 by nine pips on June 1 (at 1.4249). The disappointment from only making a new high by nine pips, was day catalyst for the start of the move to the downside which ultimately did not bottom until December 8.
Overall, the year has had a relatively narrow high to low trading range for the 2021 calendar year of 1088 pips (barring a new low next week).
That range compares to:
- 2289 pips in 2020,
- 1564 pips in 2019,
- 1902 pips in 2018,
- 1660 pips in 2017, and
- 3370 pips in 2016.
The last time the range for the calendar year was as low was back in 2012 when the low to high range was only 1076 pips. That year marked the lowest trading range for a year going back to at least 2002. You can characterize the year as non-trending at least in regard to the low to high volatility and trading range.
As mentioned, the high for 2021 reached 1.4249 on June 1. That surpassed previous highs for the year from February 24 at 1.4240 by 9 pips, and another high on May 16 at 1.4233 by 16 pips. That area will one day come back in play going forward.
The low for the year reached 1.31588 on December 8. Other subsequent lows came in on December 9 at 1.3170, December 15 also at 1.3170, and December 20 at 1.3173.
Those lows were all within a 14 bit range and proved to set a bottom heading into the end of the year, and into the new trading year.
The pair is trading near 1.3406 currently after the rally seen this week pushed the price up from 1.31732 to the high at 1.3437 (the range for the week of 264 pips or 24% of the years trading range).
Technically, looking at the weekly chart above the recent lows for the year found support at a key technical area. The low at 1.31588 stalled between the:
- 38.2% retracement of the move up from the 2020 low at 1.3164, and the
- 200 week moving average currently at 1.3140.
Clearly buyers were leaning against the key risk defining area with stops likely on a break. Going into 2022, that area will remain be a key barometer for buyers and sellers. Move below and I would expect more downside momentum. Stay above and further corrective probing can be expected.
The rise this week has also seen the price extend back above the 100 week MA at 1.3294 (blue line in the chart above). With the price near 1.3400, and the bounce off the 38.2% and 200 week MA solid, the run higher could be indicative of more upside to come. Putting it terms for traders…stay above the higher 100 week MA, and the buyers looking for more upside are not stressed.
What would increase the bullish bias?
A confirmation of the better tone will come on a move above the 1.34805 to 1.35146 area. Those two levels levels were the swing highs for 2019, and for most of 2020 respectively (until the last week in November at least).
This year, if you look at the daily chart below, that area was rebroken on September 29, stalled near the top end of that range (at 1.3516), but moved back above on October 1.

In November, the price traded above and below the area again, but on November 18, the high price reached 1.3513 – just below the 1.35146 high of the swing area – and found willing sellers that ultimately took the price down to the low for the year in December.
A move above that swing area will give the buyers some additional confidence and have traders next looking toward the 38.2% retracement of the 2021 years trading range at 1.3575. The falling 100 day moving average is also near that retracement level making it another key target on further upside momentum.
Conversely stay below the swing area and/or the 38.2% retracement/100 day moving average area, and the sellers still hold the strongest hand.
SUMMARY: 2021 saw the GBPUSD trade in a narrow high to low trading range.
The highs for the year were reached in March/April (three tops near the peak) at 1.4249.
The low for the year was reached until December at 1.31588.
At the low, the pair tested a key support area defined by the 38.2% retracement of the trading range since the 2020 low, and the 200 week moving average. Holding above that area between 1.3140 and 1.31588, gave the end of the year buyers a key area to lean against.
The price also extended back above its 100 week moving average at 1.32939. That level will act as a close bias defining level (for buyers and sellers) going into the new year. Stay above is more bullish. Move below is more bearish.
The bullish bias would increase going forward with a move above the 2019 and 2020 swing highs at 1.3480 and 1.3514. Get above those levels and traders will eye the 38.2% retracement of the 2021 trading range, and the falling 100 day moving average near 1.3575. Move above that level and buyer start to take more control.
