
Gold bulls are coming up for the last dance ahead of the all-important US Federal Reserve (Fed) policy decision, with odds of hints of an earlier-than-expected rate hike higher after Friday’s PCE inflation came in hotter. The US dollar remains broadly higher in tandem with the Treasury yields starting out a fresh month. The US Nonfarm Payrolls (NFP) release this Friday will also help determine the next direction in gold price.
Read: Gold Chart of the Week: Possible bear scalp for the open, longer-term outlook is mixed
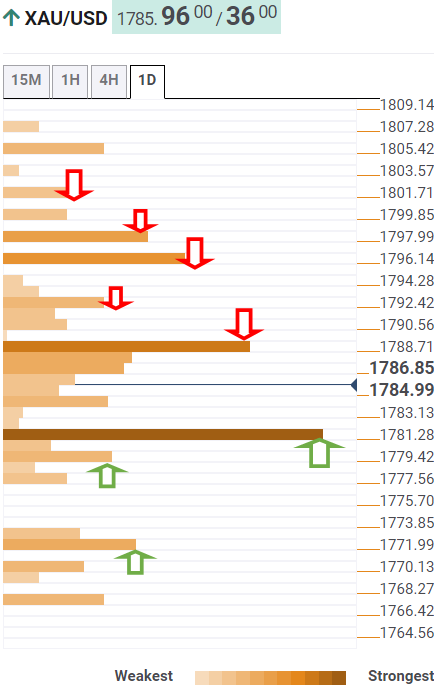
Gold Price: Key levels to watch
The Technical Confluences Detector shows that gold is approaching powerful resistance at $1789 on its road to recovery. That hurdle is the convergence of the Fibonacci 38.2% one-month and SMA100 one-day.
A sustained move above the latter is needed to take on the $1792 barrier, which is the confluence of the SMA200 one-day and SMA10 four-hour.
Up next, gold bulls eye $1796, the intersection of the SMA100 one-hour, SMA5 one-day and Fibonacci 61.8% one-week.
The Fibonacci 23.6% one-month at $1798 will be on the buyers’ radars if the bullish momentum remains unabated.
The meeting point of the previous day’s high and pivot point one-day R1 around $1801 will be the level to beat for gold bulls.
On the flip side, strong support is now seen at the previous resistance at $1782, where the SMA50 one-day and Fibonacci 23.6% one-week merge.
The next critical demand area is aligned around $1778-$1780, where the SMA100 four-hour, Fibonacci 23.6% one-day and the previous low four-hour coincide.
Further south, the confluence of the previous day’s low and Fibonacci 61.8% one-month at $1772 will test the bullish commitments.
Here is how it looks on the tool
About Technical Confluences Detector
The TCD (Technical Confluences Detector) is a tool to locate and point out those price levels where there is a congestion of indicators, moving averages, Fibonacci levels, Pivot Points, etc. If you are a short-term trader, you will find entry points for counter-trend strategies and hunt a few points at a time. If you are a medium-to-long-term trader, this tool will allow you to know in advance the price levels where a medium-to-long-term trend may stop and rest, where to unwind positions, or where to increase your position size.