- Gold has been offered in a mixed session, with the US dollar holding at higher levels.
- The risk-on sentiment has dented the allure of the safe-haven metal.
- Central banks and economic data could love the needle over the next couple of weeks.
Update: Gold price is looking to extend Tuesday’s sell-off, as the sellers find a foothold below the all-important 200-Daily Moving Average (DMA), now at $1793. The US dollar is holding onto its recent advance, keeping the downside pressure intact on gold price.
Ahead of the US Q3 GDP release, the intermarket correlations seem to have gone haywire, as the dollar rose alongside the risk-on market mood after the American tech titans reported strong corporate earnings on Tuesday. The risk appetite combined with the greenback’s surge knocked off gold price to the lowest levels in three days at $1782. Although the downside appears limited in gold price amid rising global inflation fears, in the face of surging energy prices and supply chain crisis.
Read: US Third Quarter GDP Preview: A very uncertain estimate
The price of gold has been offered on Tuesday, but it was established in the New York sessions and has found an equilibrium near the 10-day EMA in the current range. XAU/USD is sat in the $1,790s in a quiet start to the Asian session.
The price fell on Tuesday from a high of $1,808 and made a low of $1,782 before settling back to the close of $1,792. The markets were overall risk-on with US equities marginally higher but printing fresh record highs amid strong reported company earnings. In the same bullish light, US data on Housing, Consumer Confidence and Manufacturing all beat expectations, yet, the greenback was mixed, leaning bullish into the close on Wall Street.
The markets are waiting for news from upcoming central bank meetings that might spark volatility over the next couple of weeks while economic data could also move the needle and shift views on interest rates, inflation and growth rates.
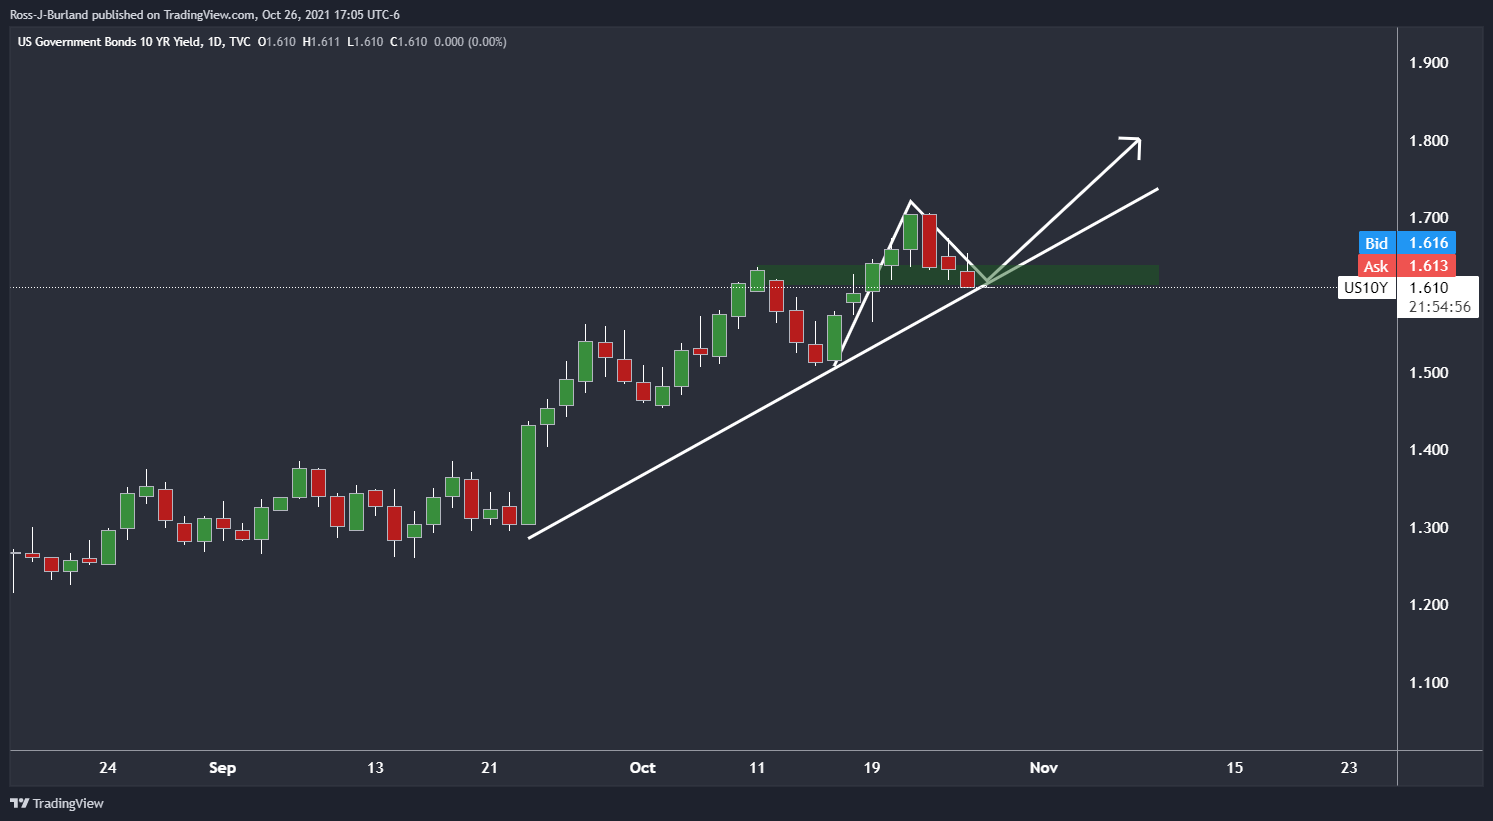
In this regard, the US yields on 10-year kept in a narrow range before sliding to 1.610% in the afternoon in New York. With that being said, the yield is now meeting a dynamic support line on the daily chart as follows, so the trajectory from here could be to the upside:
Meanwhile, the positive earnings season is hurting the safe-haven assets such as gold. Nevertheless, concerns that inflation is becoming more persistent should provide some support to gold prices.
Reasons to own the yellow metal, more compelling
‘Ten-year breakeven yields continue to firm at their highest levels since 2012, as speculators brace for inflation. In this context, global markets remain intensely focused on pricing the Fed’s exit, with the recent surge in market-based inflation expectations fueling bets for an earlier Fed hike.”
”Yet, we continue to argue that market pricing for Fed hikes remains far too hawkish as it fails to consider that a rise in inflation tied to a potential energy shock and lingering supply chain shortages would be unlikely to elicit a Fed response,” the analysts argued.
”In fact,” they said, ”the market is increasingly pricing in a policy mistake which is unlikely to take place, considering that central banks are likely to look past these disruptions as their reaction functions have been historically more correlated to growth than inflation.”
”In this sense,” the analyst concluded, ”reasons to own the yellow metal are growing more compelling as Fed pricing is likely to unwind. While this narrative has yet peaked, we expect a deceleration in US economic activity, as a result of a growing fiscal drag, to catalyze a repricing.”
Gold technical analysis
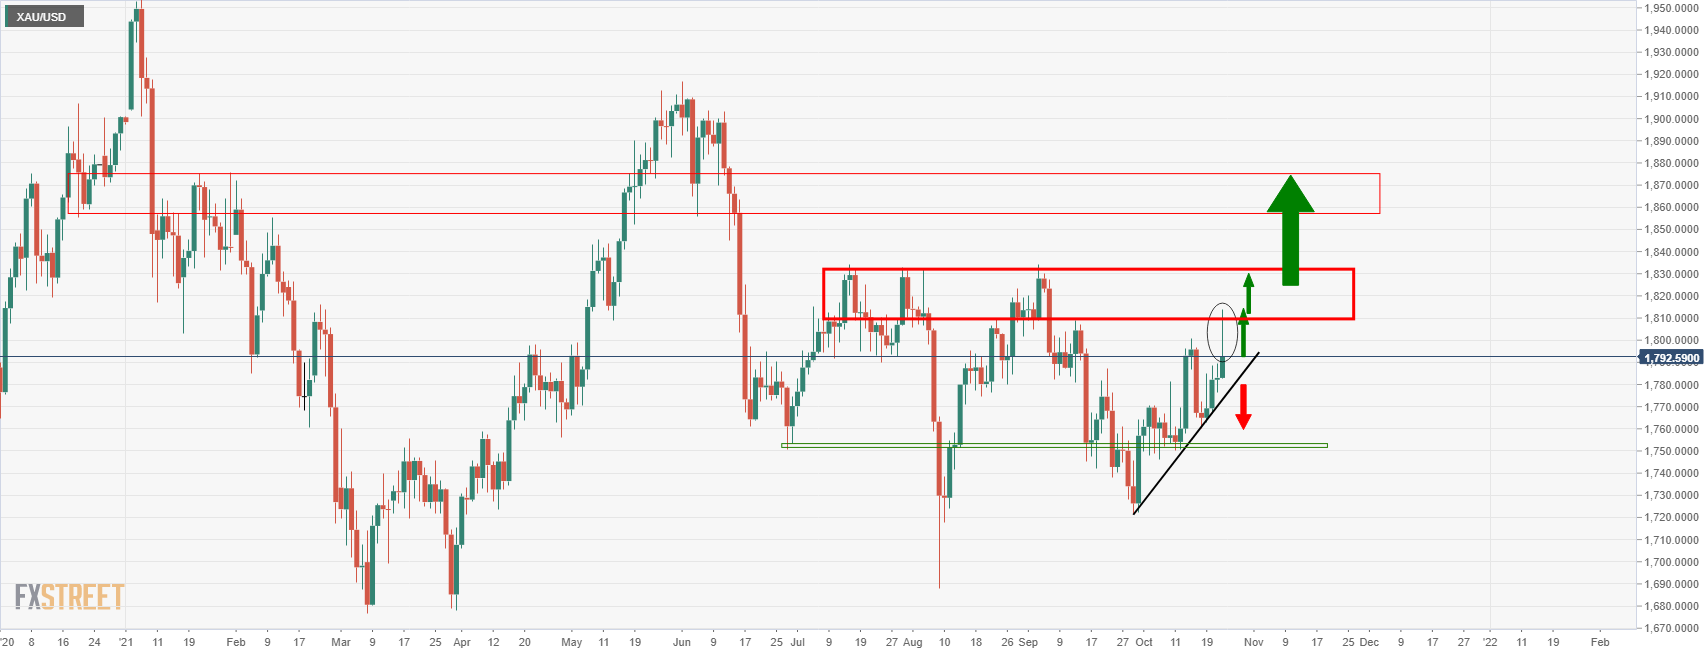
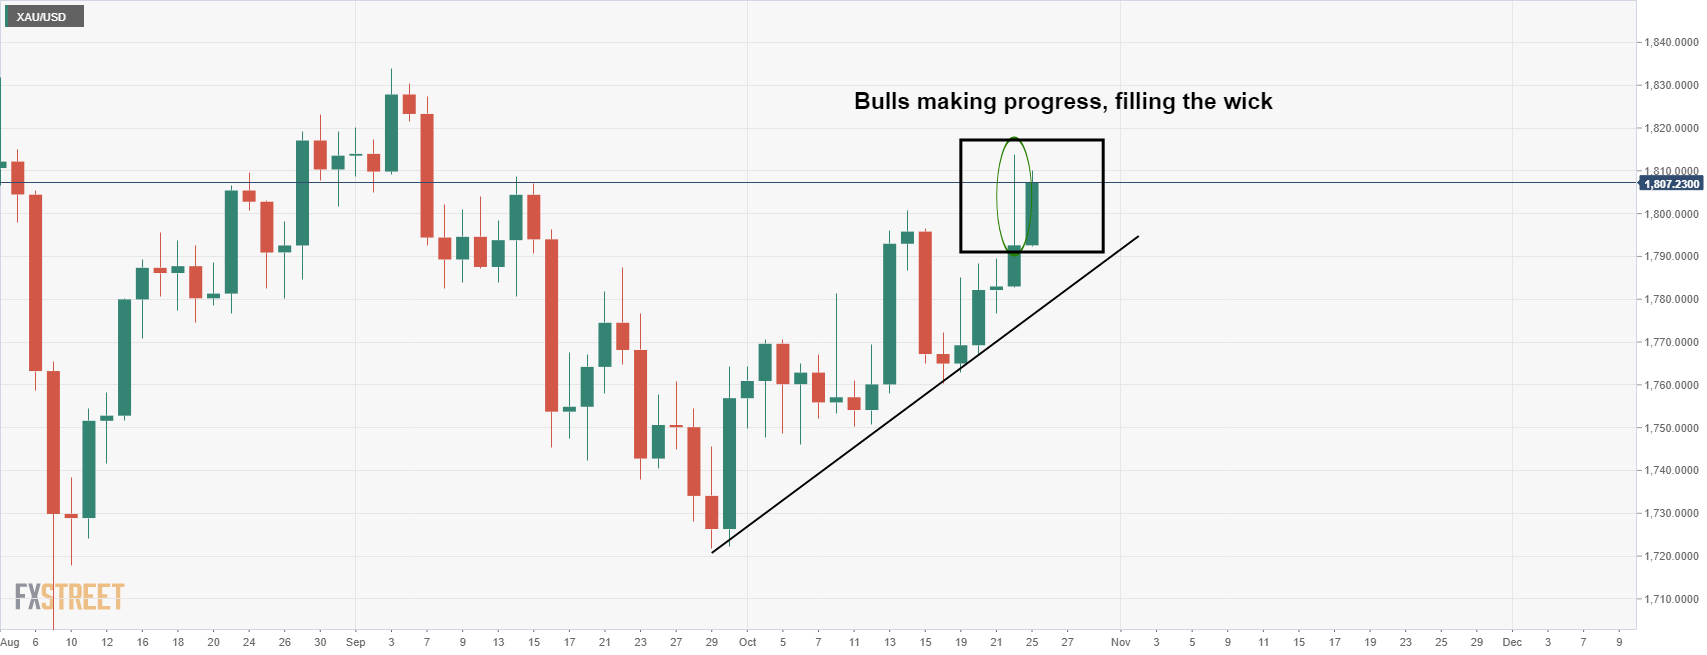
From a daily perspective, the price has been trying to move higher, as Friday’s price action shows, and the wick’s high of the daily candle was a likely target for the sessions ahead, as illustrated in the following pre-market open analysis: Chart of the Week: Gold bears lurk at weekly trend line resistance
”$1,835 guards territory to $1,880 as follows:
Gold bulls were making progress
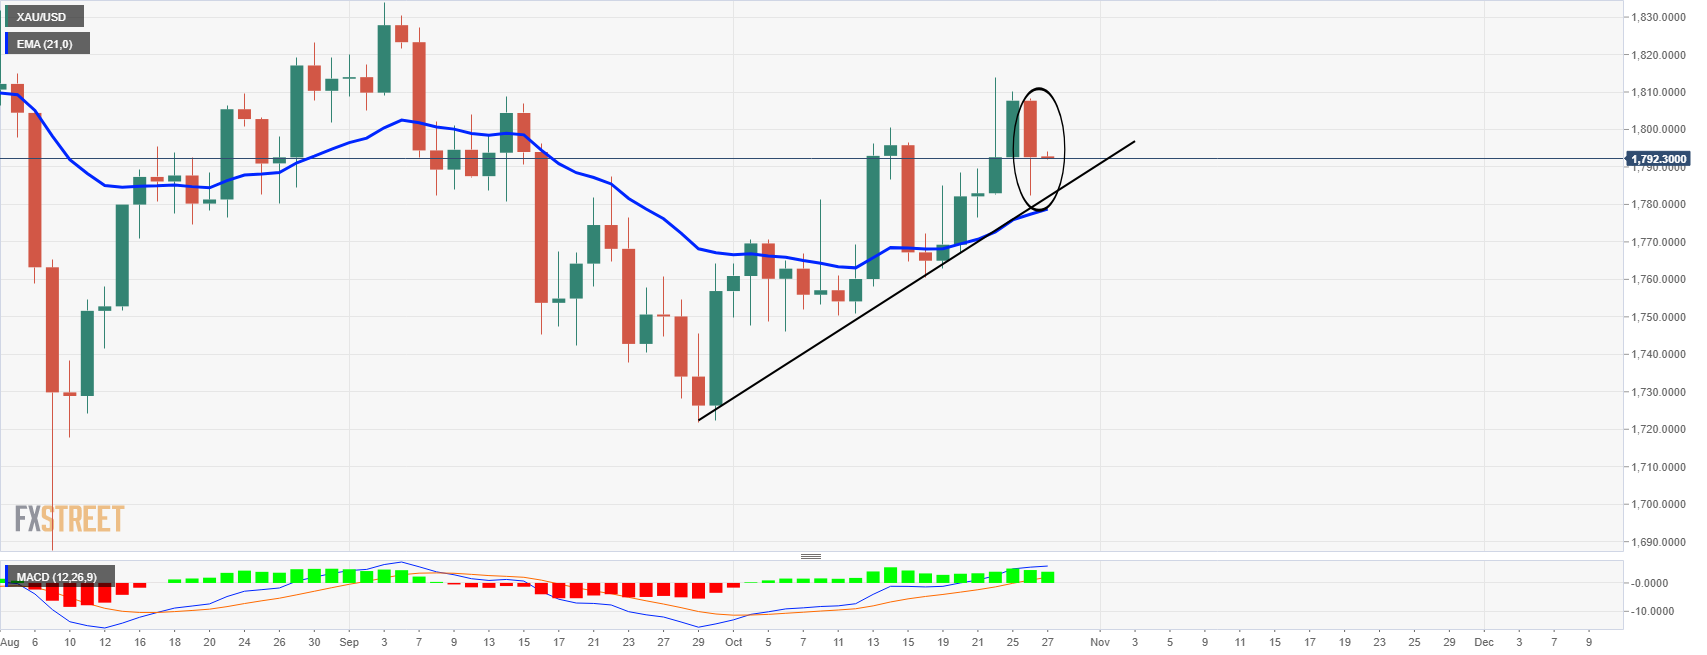
The price action on Tuesday, however, has moved in for a significant test of the dynamic support as follows:
The price has left a tweezer top which indicates that the price could move in for another test of the dynamic support and the 21-day moving average in the forthcoming sessions. So long as this structure holds, the bias remains with the upside as MACD remains bullish.


 This “NEW CONCEPT” Trading Strategy Prints Money!… (INSANE Results!)
 RULE-BASED Pocket Option Strategy That Actually Works | Live Trading