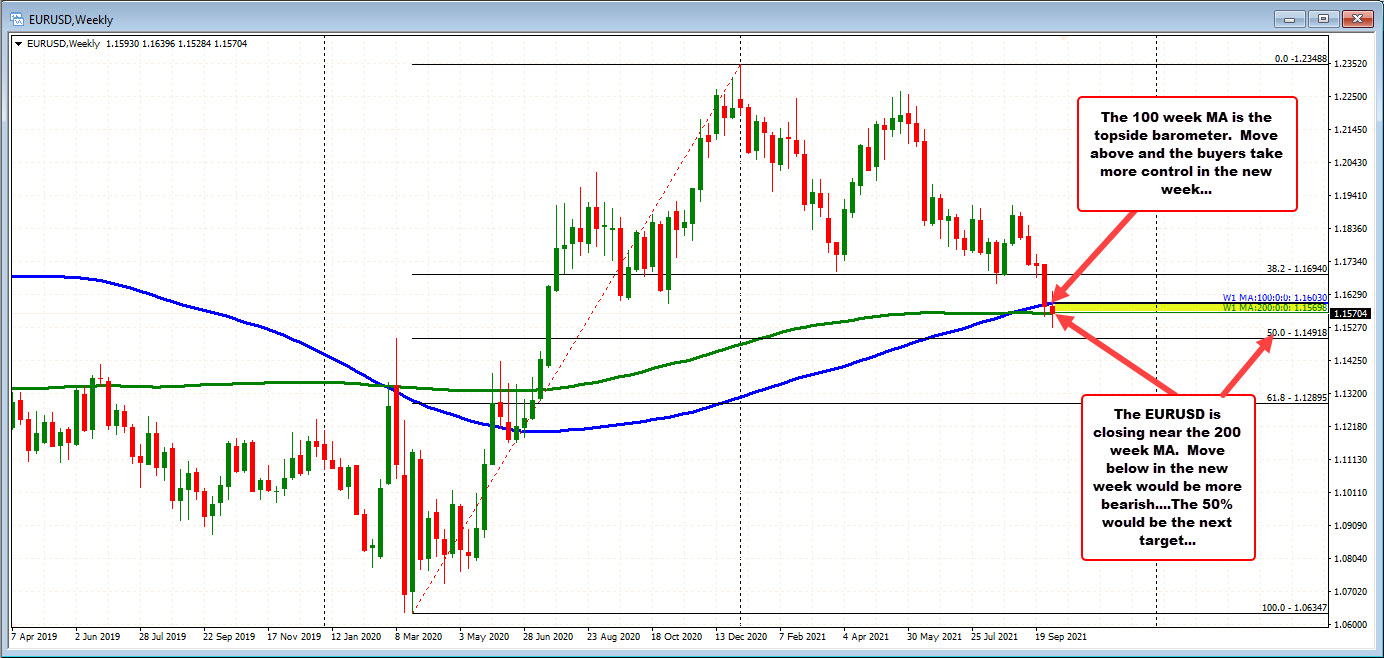
What to know from a technical perspective.
EURUSD: The EURUSD is looking to close the week right around the 200 week moving average at 1.1570 after trading above and below that MA, and the 100 week MA at 1.1603. The current price is at 1.1570.
In the new week, those MAs will continue to be barometers for the pair’s bias. Move below will be more bearish. Move above and the buyers/bulls are more in control.
On a move below the 50% of the range since the March 2020 low come in at 1.1492.
On a move higher, in addition to the 100 week MA is the falling 200 hour MA which is currently at 1.1595. So a move above it and the 100 week MA at 1.1603 would open up the door for more upside potential
USDJPY: The USDJPY traded to the highest level since April 2019 after trading above the February 2020 high price of 112.22. The high today reach 112.24 which made a new high, but I wouldn’t say the buyers were all that excited about the break (at least on a Friday).
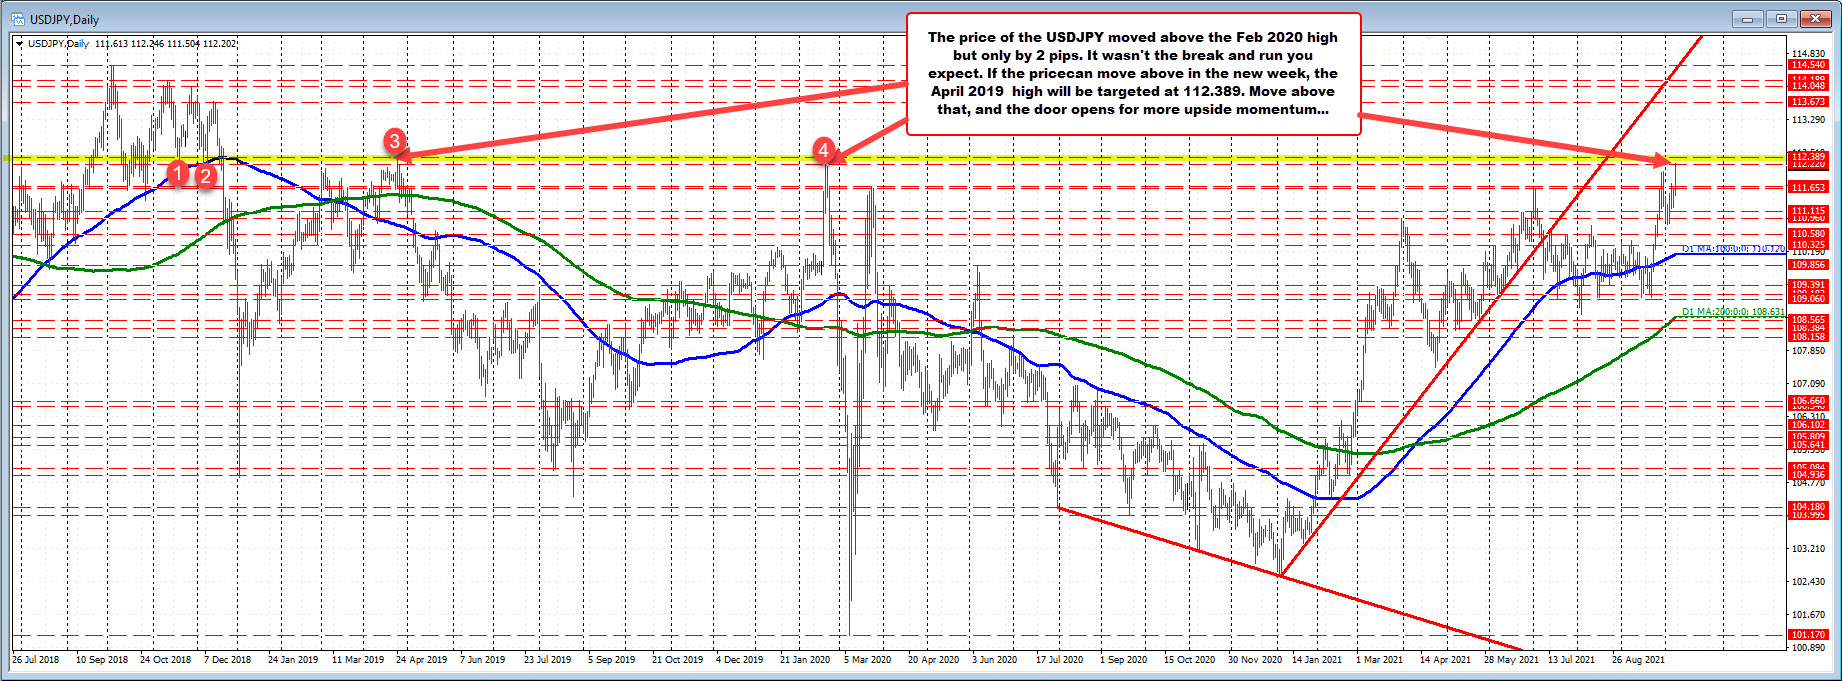
Next week may be a different story, as the traders enter with a continuous market to control risk at the highs. Move above and then the April 2019 high price of 112.389, and the door opened for further upside momentum. Those are the key levels to the upside in the new trading week.
If the price can’t get above that level, and a rotation back below the September high of 112.07, will have traders looking for more downside probing on the inability to break higher. The Wednesday high price at 111.78 and the rising 100 hour moving average at 111.482 would be the closest targets on selling.
GBPUSD: The GBPUSD traded to the highest level since September 28 today at 1.3655. That move got close to the 50% midpoint of the move down from the September 14 high at 1.3662. The price rotated lower and stalled at 1.3609. That was just above the 100 hour moving average at 1.3604.
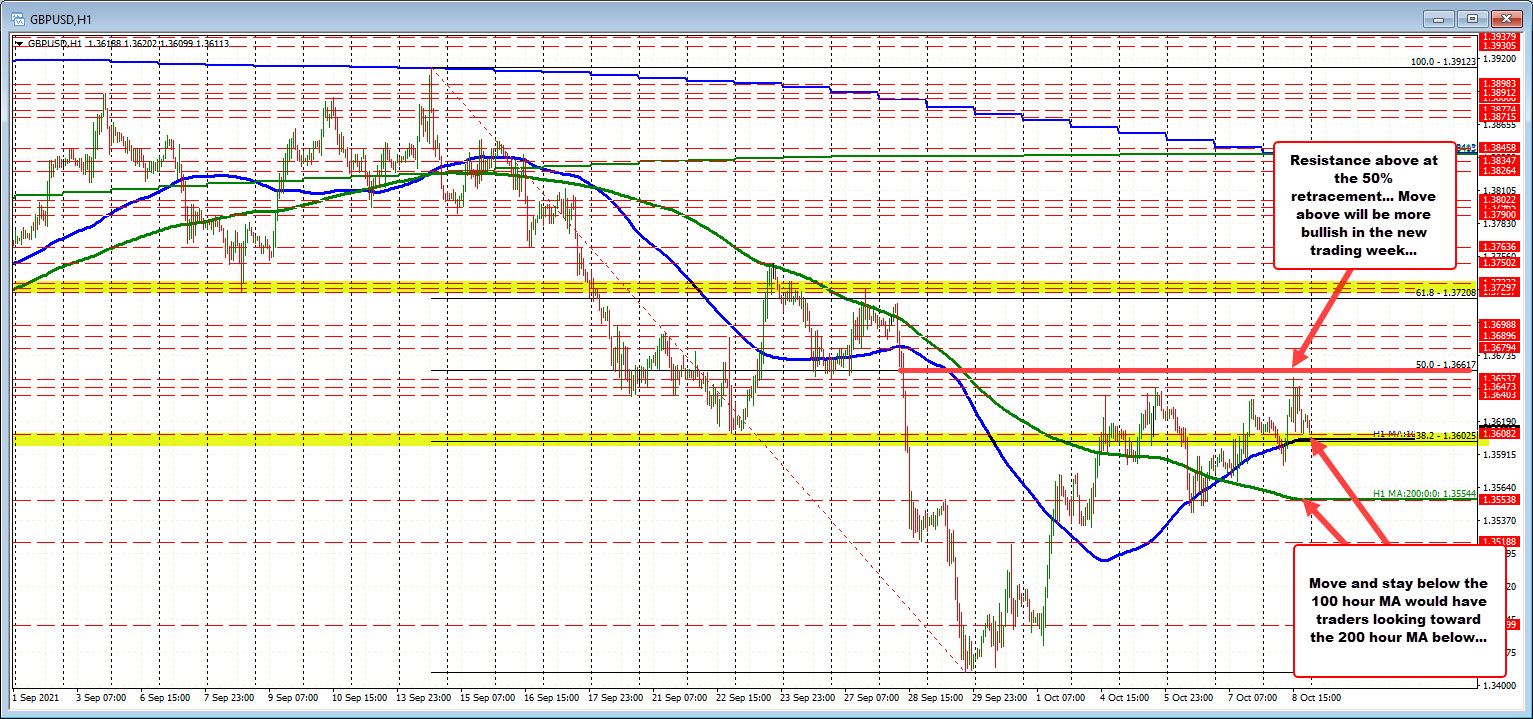
With the 50% retracement above at 1.3662, and the 100 hour moving average below 1.3604, those two levels become the targets to get to and through. Break below the 100 hour moving average and stay below is more bearish. Hold the 100 hour moving average and move up and through the 50% retracement, increase the bullish bias.
USDCAD: The USDCAD moved below to longer-term moving averages today after Canada job gains were stronger than expectations, while the US job gains were weaker. The price decline took the USDCAD below the 200 day moving average at 1.2511 and the 100 day moving average at 1.2480. The current price is trading at 1.2472 below both those MAs which gives a bearish bias going into the weekend.
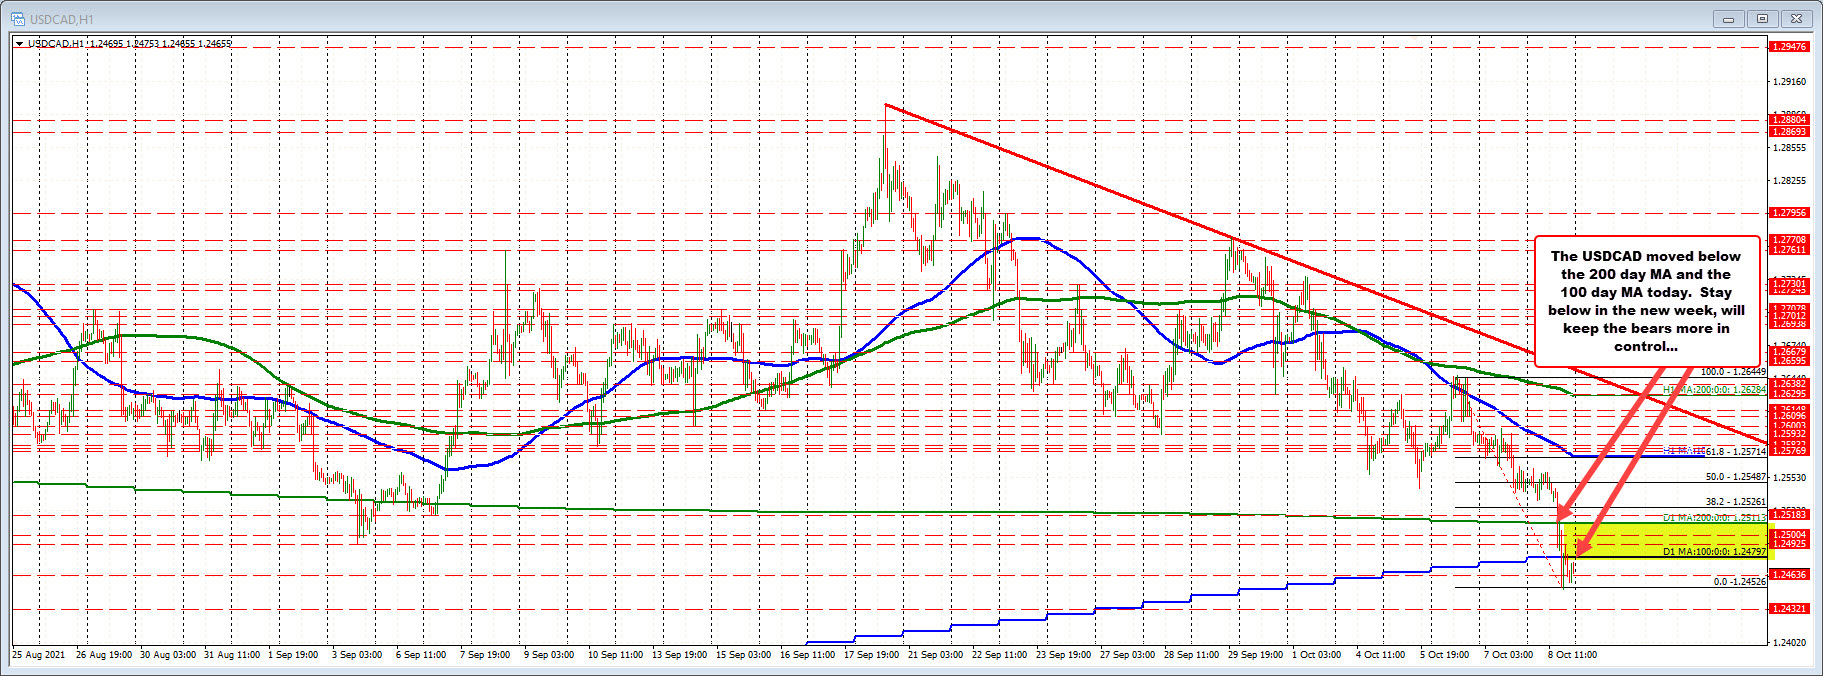
In the new trading week, stay below those moving averages will keep the sellers more in control from a technical perspective.
Conversely move above the 100 day moving average with momentum would tilt the bias more in the upward direction, with a break of the 200 day moving average at 1.2511 a confirming bullish break.
Absent that, and the bears remain more in control, with the swing lows from July 14 and July 30 at 1.2422 as the next key target to get below and stay below.
NZDUSD: The NZDUSD this week made it’s high on Monday at 0.6981. On Wednesday, the Reserve Bank of New Zealand raised rates by 25 basis points to 0.50%.
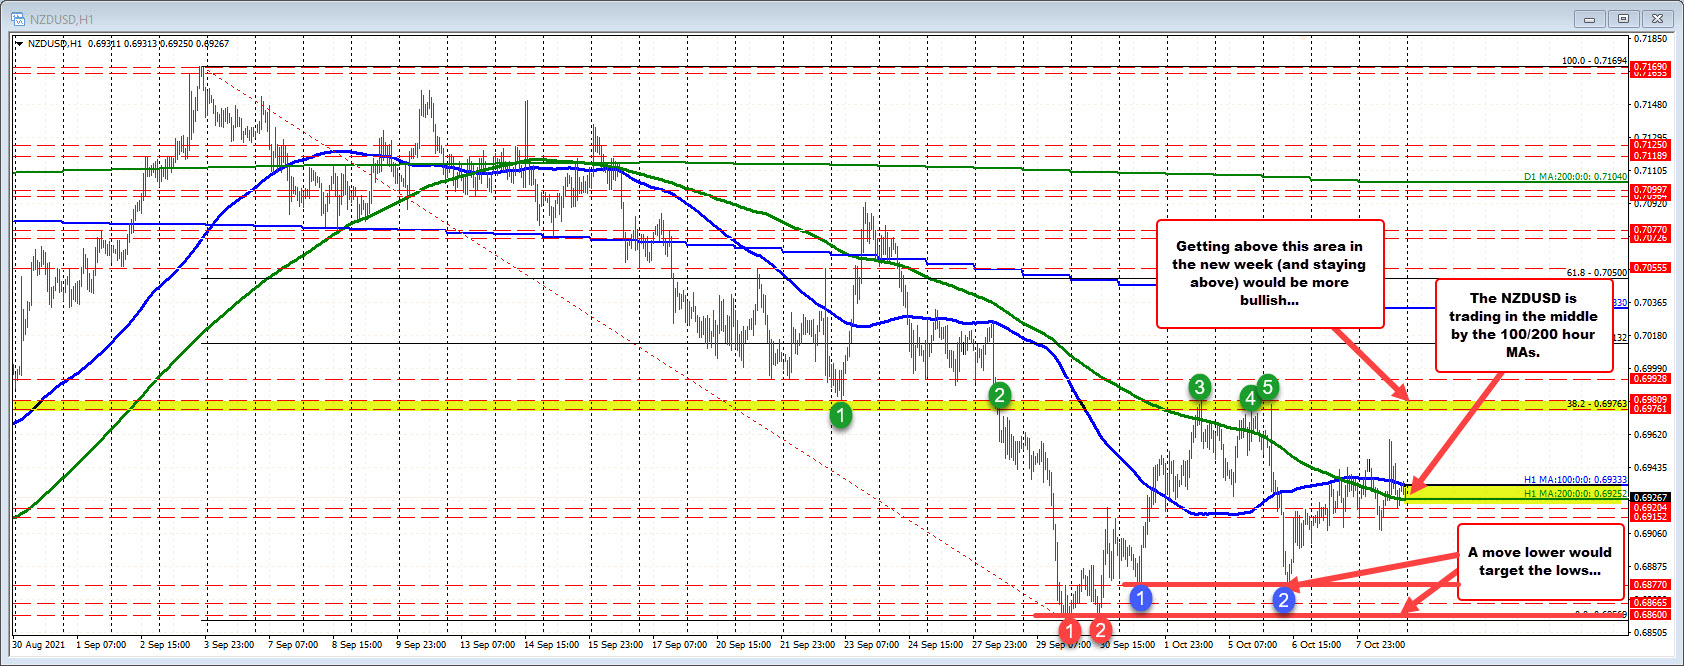
The price of the NZDUSD briefly spiked to a high of 0.6979, just below the Monday high. The inability to break above that level sent the price tumbling down to test a swing low from last Friday at 0.6877. The price stalled there and has been trading above and below the 100 and 200 hour moving averages near the middle of that trading range (at 0.6934 to 0.6925 respectively). The current price is trading between the MAs at 0.6930.
In the new trading week, traders will decide on whether the pair sees more “risk on” flows in which case moving away from the 100 and 200 hour moving averages and toward the highs at 0.6981 is the path of least resistance. Move above the 0.6981 level opens the door for further upside potential with the 0.7000 level and the falling 100 day moving average at 0.7033 as the next upside targets.
Conversely, a “risk off” sentiment would have the NZDUSD pair moving away from the hourly moving averages at 0.6933 and 0.6925. The double bottom’s at 0.6877 would be targeted followed by the swing low from September 29 at 0.68569.
