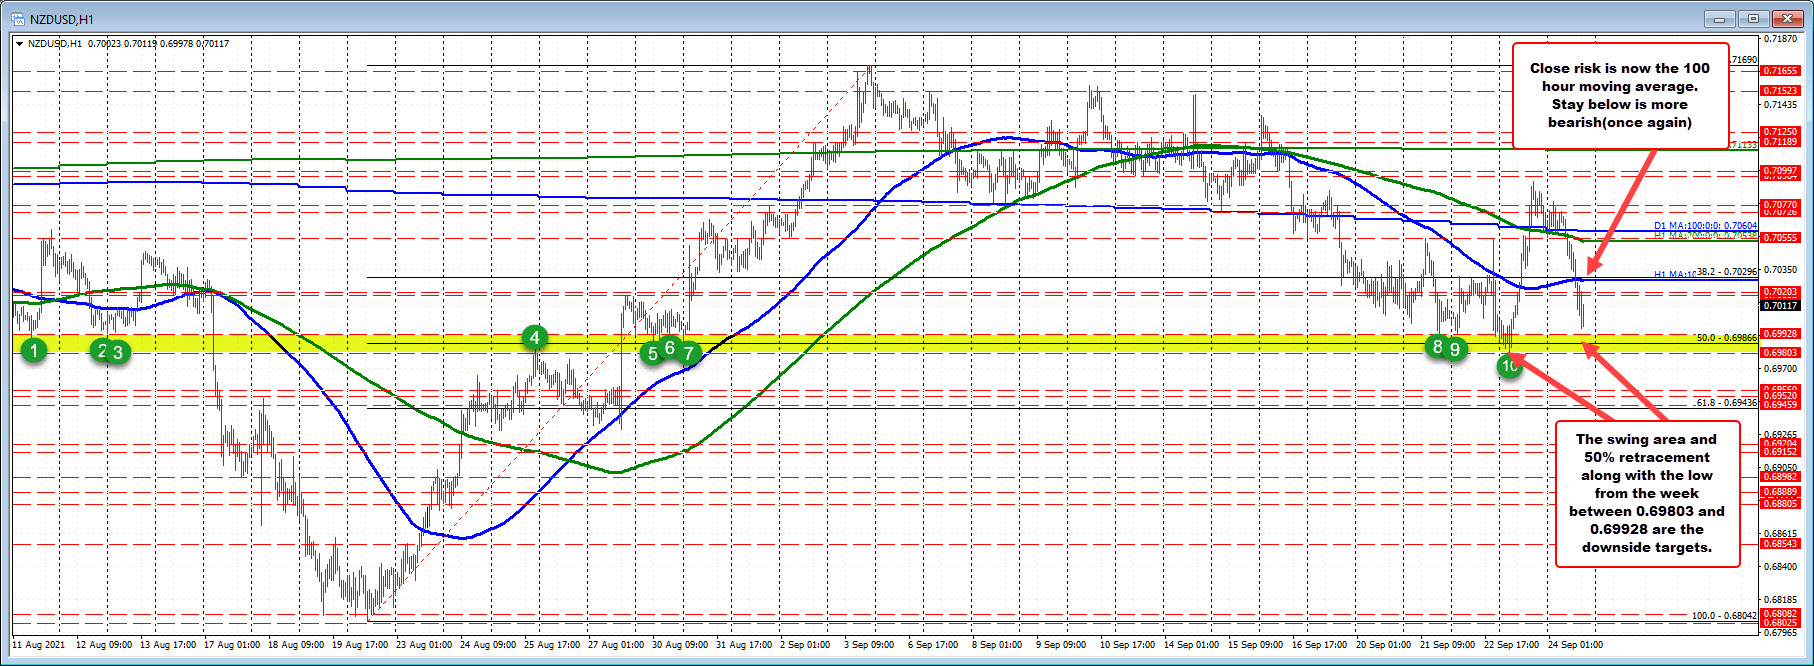
Technical selling as to the move to the downside
The NZDUSD moved sharply higher yesterday and in the process trended above the 100 hour moving average (blue line), the 200 hour moving average (green line) and 100 day moving average, and above a swing area near 0.7075.
The pair did rotate back down toward the 200 hour moving average and the 100 day moving average late in the New York session yesterday near the 0.7060 area, and had a modest bounce, at the start of the Asian session.
However, sellers were able to push the price back below those moving averages and that helped to turn the buyers and sellers.
The selling today continued through the 100 hour moving average and back below the 38.2% retracement of the range since the August 20 low near 0.70296.
The price decline has stalled ahead of its 50% retracement at 0.69866 and swing lows from Tuesday and Wednesday as well just above that level at 0.69928. It would take a move below each of those levels and the low from yesterday at 0.698032 now to increase the bearish momentum.
Close risk for shorts/sellers is now the 100 hour moving average and 38.2% retracement near the 0.70296 level. Stay below is more bearish. Move above and the pair is back between the moving average levels (and more neutral).
