NASDAQ index trading to a new session low
The US stocks have heading lower.
The NASDAQ index is now trading at new session lows down about -60 points or -0.39% at 15187.40.
The Dow is down -146 points or -0.42% at 34731.
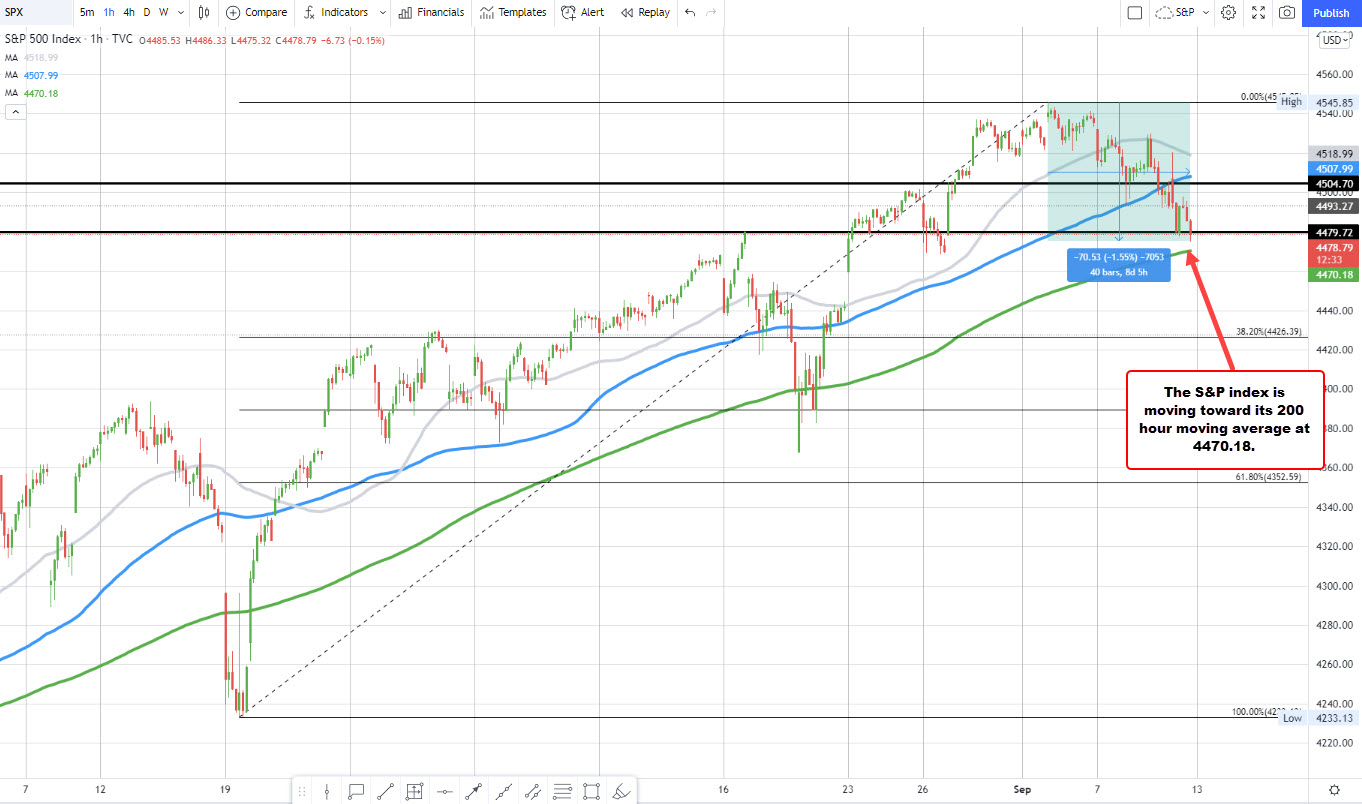
The S&P index is down -16.75 points or -0.37% at 4476.43.
Both the Dow and S&P are now on track for their fifth consecutive down day. The NASDAQ index is working on its third day to the downside.
All three indices are lower for the week.
For the S&P index, the price is getting closer to its 200 hour moving average of 4470.17. The last time the index traded below that moving average was back on August 19. A move in close below would be more bearish.
Looking at the NASDAQ chart, it has already moved below its 100 hour moving average at 15178.29. The index is down -1.46% from the highs reached on September 7. Stay below the 100 hour moving average would be more bearish for the NASDAQ index
This article was originally published by Forexlive.com. Read the original article here.
