10 year yield moves to a high of 1.385%
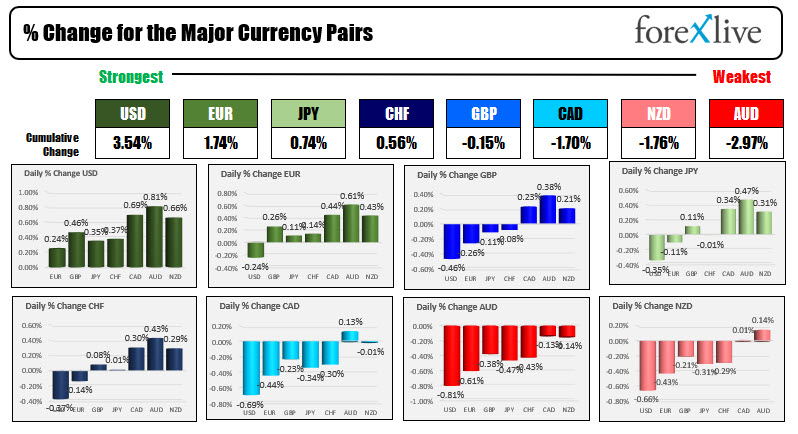
The USD has moved to a new intraday high versus all the major currencies. The greenback is following the rise in the US rates with the 10 year yield moving up to a high of 1.385%. That is the highest level since July 14. The USD is the strongest of the major currencies. The AUD is the weakest.
EURUSD: The EURUSD is moving further away from its 100 hour moving average at 1.18646. The low price just reached 1.18367. The swing low from Thursday’s trade comes in at 1.18335. The rising 200 hour moving averages at 1.18274. The price has not traded below its 200 hour moving average since August 25.
GBPUSD: The GBPUSD has been trading above and below its 200 hour moving average in the early New York session. That 200 hour moving average currently comes in at 1.37832. The price is also below the 38.2% retracement of the move up from the August 20 low. That comes in at 1.37806. On the downside, the next target is the 50% retracement of the move up from the August 20 low at 1.37464.
USDJPY: The USDJPY as reached the swing area between 110.22 and 110.263. The high price just reached 110.237. A move above the swing area will have traders targeting the high from last week at 110.414. Most of the price action over the last 15 trading days has been between 109.56 and 110.263. Will sellers leaned against the swing area? If they do I would expect stops on a break of 110.263.
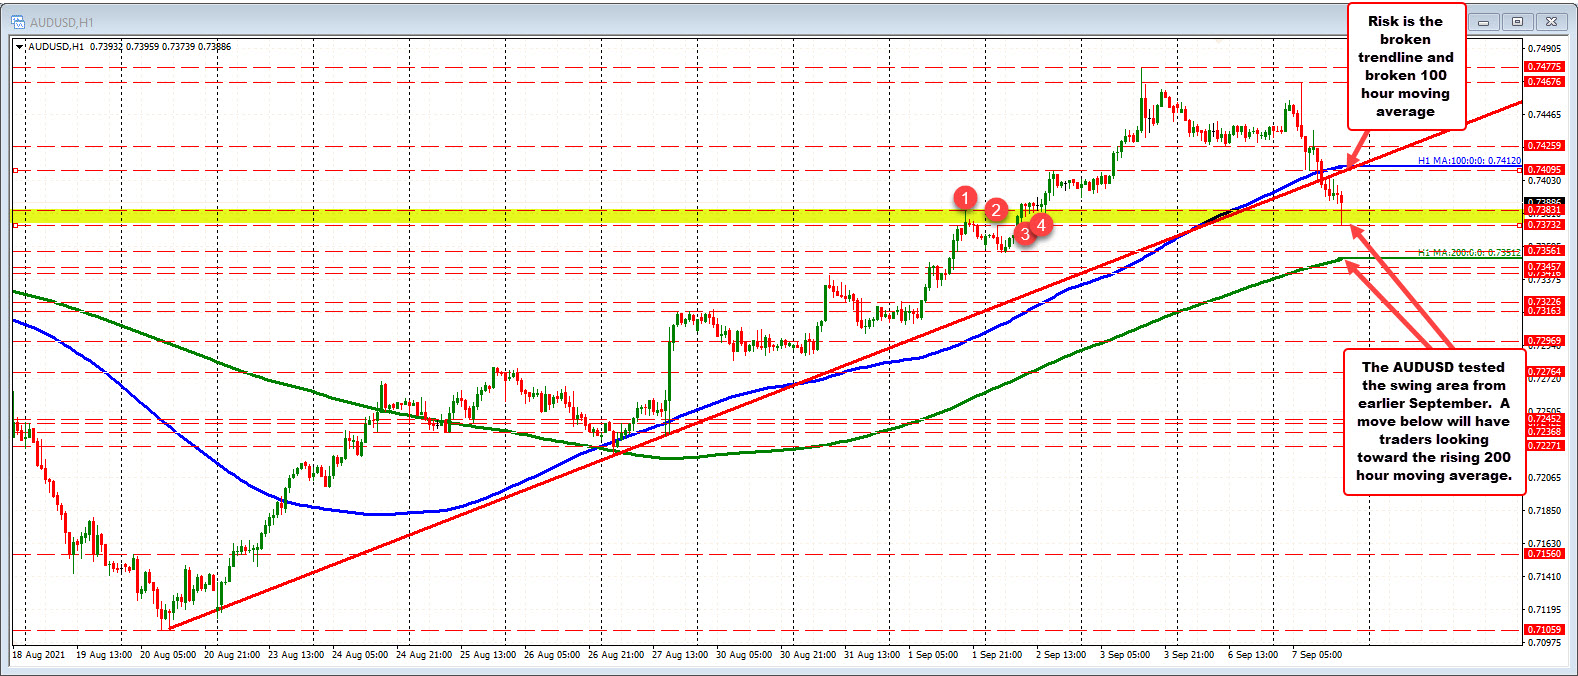
AUDUSD: The AUD is the weakest of the major currencies after the RBA tapered modestly as expected but announced that they would spread out the taper over a longer period of time. Looking at the hourly chart below, the price fell below its 100 hour moving average, and a upward sloping trendline today. The price low reached 0.7373 that low tested swing highs and lows going back to September 1 and September 2..

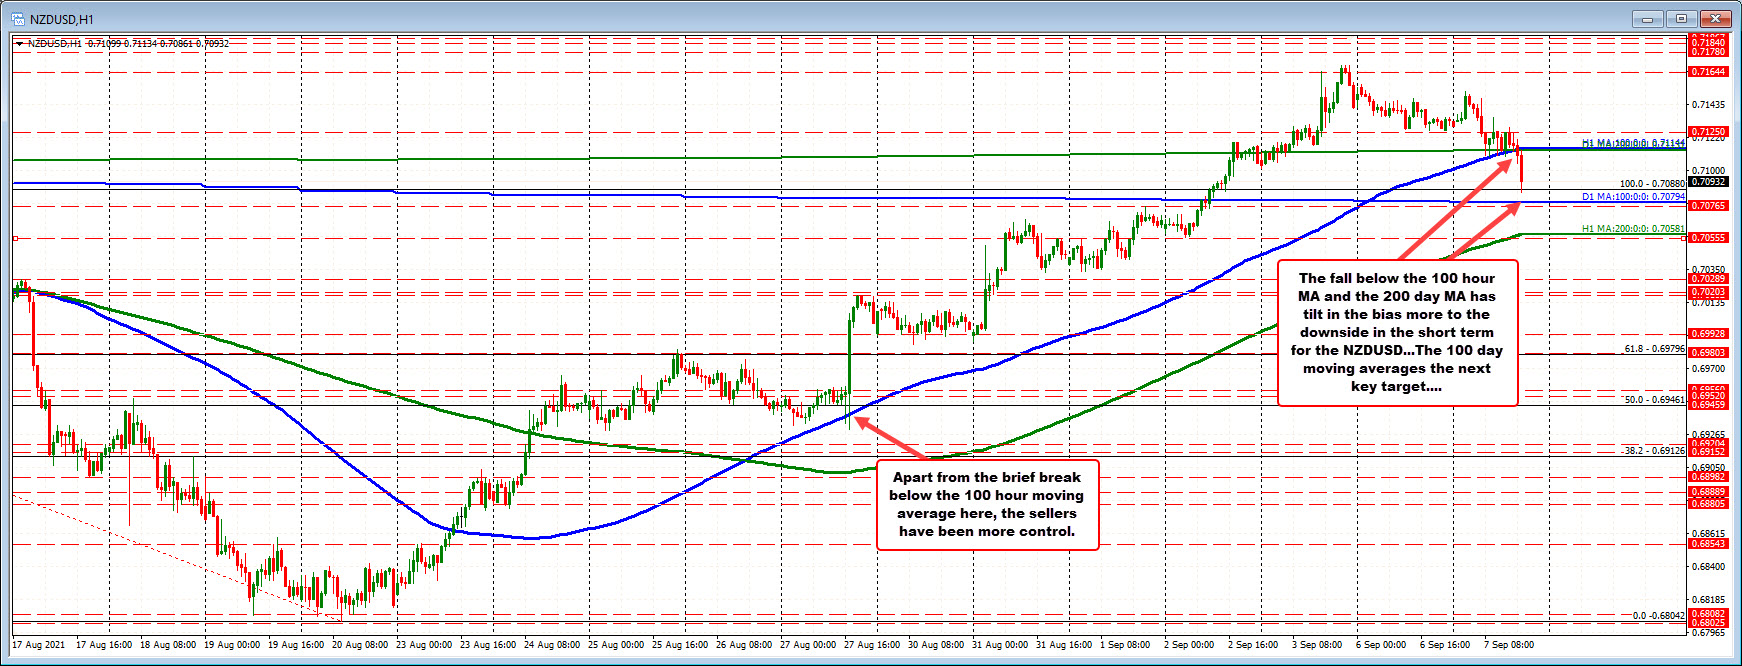
NZDUSD: The NZDUSD has fallen below its 100 hour moving average and 200 day moving average which are both near the 0.71144 area. The break has the pair moving toward the next key daily moving average at its 100 day moving average at 0.70794. The low price reached 0.70861 so far before bouncing marginally.

Going forward, stay below the 200 day moving average/100 hour moving average keeps the sellers in play for more corrective downside probing. However getting below the 100 day moving averages it is still needed to increase that bearish bias. That level currently comes in at 0.70794
The NZDUSD has been rising steadily since bottoming on August 20. The pair broke above its 100 hour moving average back on August 23, and apart from a brief break below that moving average on August 27, the price has not traded materially below that MA line.
As a result, the fall below its 100 hour moving average is a tilt in the bearish direction at least in the short term.
