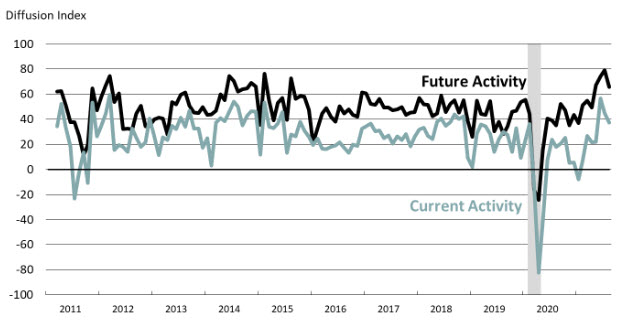
Philadelphia-area service sector data
- Prior was 53.8
- Firm-level activity 37.2 vs 44.8 prior
- New orders 27.4 vs 31.8 prior
- Wage and benefit cost index 43.0 vs 50.2 prior
- Full time employment index 8.2 vs 24.8 prior
This is a low-tier indicator.
Here was the special question, which relates back to inflation expectations — something the Fed watches very closely:
In this month’s special questions, the firms were asked to forecast the changes in the prices of their own products and services and for U.S. consumers over the next four quarters. Regarding their own prices, the firms’ median forecast was for an increase of 3.8 percent, higher than the 3.0 percent increase reported in May. Regarding the firms’ own price change over the previous year, the median response was 2.0 percent, up from 1.6 percent in May. When asked about the rate of inflation for U.S. consumers over the next year, the firms’ median forecast was 4.5 percent, higher than the 4.0 percent recorded in May. The firms expect their employee compensation costs (wages plus benefits per employee) to rise 4.0 percent over the next four quarters, up from 3.0 percent in May. The firms’ forecast for the long-run (10-year) inflation rate increased to 5.0 percent from 4.0 percent in May.
