- On the session, the USD/CHF is down 0.14%, trades around 0.9176.
- The daily chart supports the uptrend.
- In the case of a short correction, price will tend to favor buyers
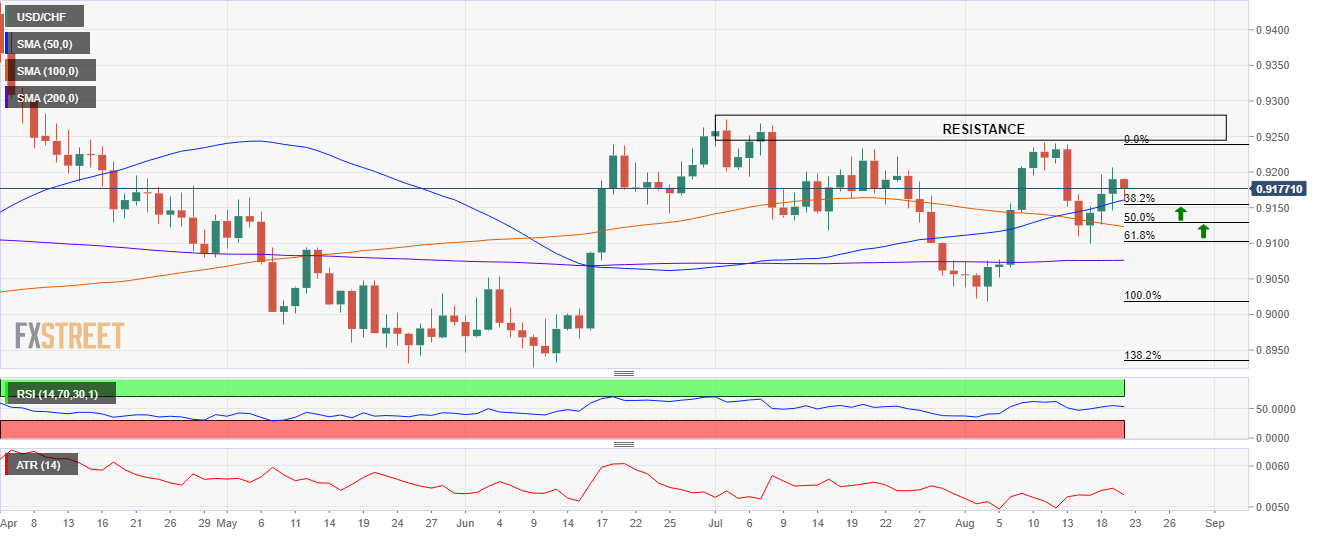
Daily chart
The price is trading around 0.9170. The daily moving averages stand underneath the spot price, and support moves towards the upside, however, recent price action is moving down.
The low of today’s sessions was 0.9158 which is the confluence of the 38.2% Fibo retracement and the 50-day moving average. Further down around 0.9100 lies the 100-DMA and the 61.8% Fib retracement, where buyers could step in for better prices. Lastly, a test to the 200-DMA at 0.90659 which confluences with the 78.6% Fibo retracement, is also a challenge for sellers.
In regards to the upside, there is a clear path, with 0.9200 as the first resistance, followed by the 0.9245-75 range wherein lies the July 2 high and the August 11 high, and then the 0.9300.
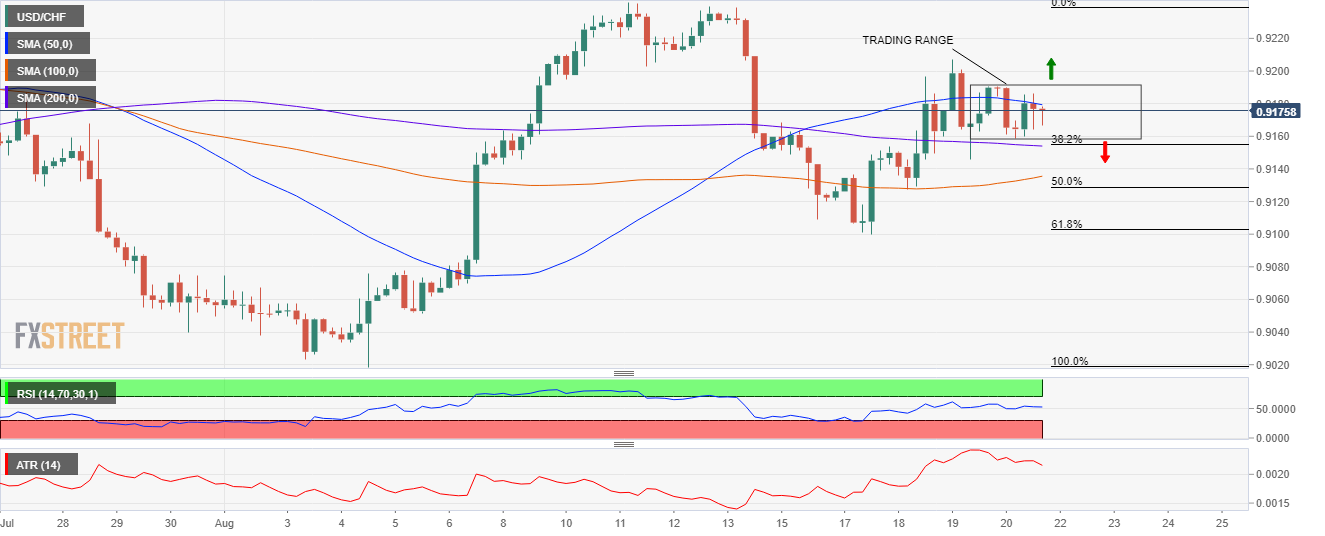
4-hour chart
The pair is in between the 50 and the 200-simple moving averages. The price is trapped inside the 0.9150-0.9200 range, with no trend in place.
A break to the downside opens up a test at 0.9130 where it lies the 100-SMA, the 50% daily Fibo retracement, and an up trendline. Failure to defend that level, then the next support is 0.9100.
On the other hand, a break upwards, the price will challenge the 0.9200. If sellers fail to hold the level, the pair will test the August 11 high at 0.9247, then the July 2 high at 0.9274, and finally the 0.9300 level.

