Earlier gains are erased
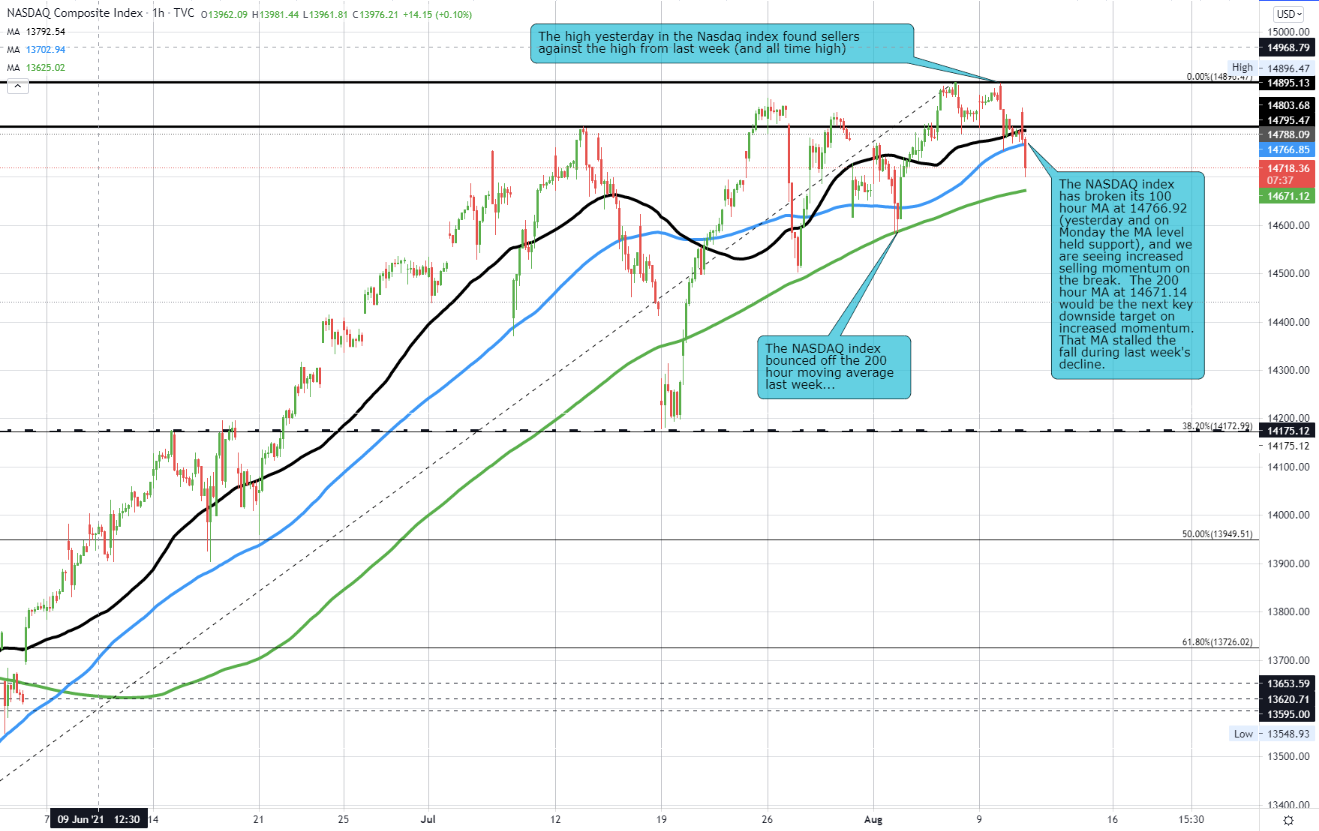
The NASDAQ index has cracked below its 100 hour moving average and scooted lower. Recall from yesterday, and Monday as well, the index’s price tested the 100 hour MA, only to find buyers leaning against the level.
Today’s crack below the moving average, led to stops being triggered and the price showing increased downside momentum. Stay below the 100 hour MA will keep the sellers more in control going forward.
On the downside, the next target comes against the 200 hour moving average (green line). Last week, the price fell toward that level and found support buyers. THe week before, the price sniffed the moving average line, but once again found willing buyers ahead of the key risk/bias defining level. A break below would increase the bearish bias and there should be more downside momentum.
Helping the bearish bias this week was the inability of the pair to extend above the high from last week’s trade during the early Tuesday trading session (that was the all time high too). Since then the sellers have taken more control.
