Index tests it 50 hour moving average
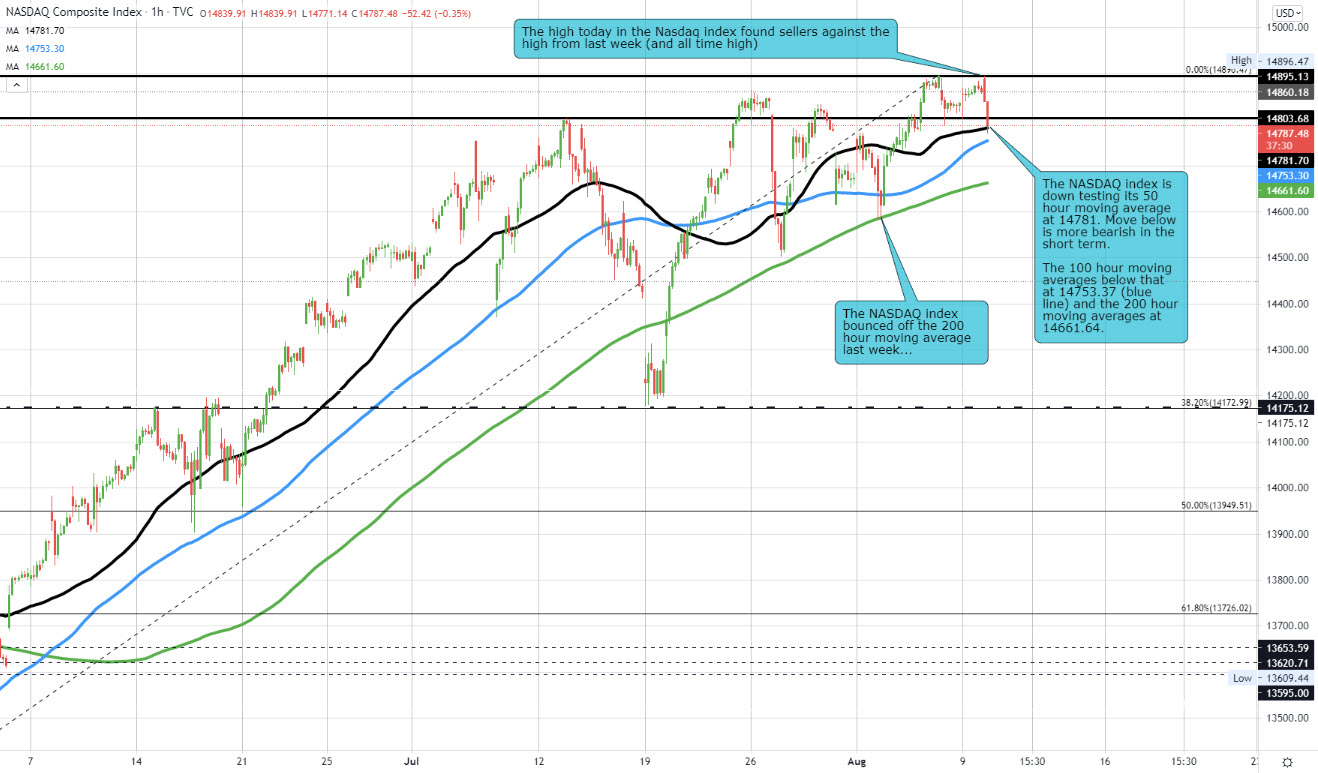
The NASDAQ stocks are coming under pressure after stalling ahead of the all-time high from last week at 14896.47. The high price today reached 14894.62 before rotating back to the downside.
The run lower has seen the price move just below its 50 hour moving average at 14781.70. The low price reached 14771 and bounced modestly. A break back below the level should lead to more downside momentum going forward
Traders will now eye the swing high from July 13 at 14803.68 as close resistance. If the sellers are to remain more in control intraday, staying below that level would be a bearish development.
A move back below the 50 hour moving average will have traders looking toward the 100 hour moving average at 14753.30. Below that is the rising 200 hour moving average at 14661.60.
Looking at the hourly chart above, the price decline last week stalled right against the 200 hour moving average (green line) and bounced. In the previous week, buyers also leaned ahead of that moving average level. Keep that moving average in mind going forward on further weakness.
