- SPCE stock is not to be left behind as AMC heads for the moon.
- Virgin Galactic is not heading for the moon, just the space.
- SPCE shares rally after successful test flight but stall at resistance.
Virgin Galactic returned to space last weekend and this week has seen the shares soar, excuse the easy pun. AMC though clearly looks to be headed for the moon or even mars, the way the shares are surging again in Friday’s premarket. Last weekend, SPCE completed a successful space flight of its VSS Unity spacecraft from New Mexico.
Michael Colglazier, CEO of Virgin Galactic, said that the flight “showcased the inherent elegance and safety” of the company’s spaceflight system. Colglazier added that Virgin “will immediately begin processing the data gained from this successful test flight.”
Virgin Galactic fulfilled a number of test objectives during the flight, including collected data to be used for the final two verification reports that are required as part of the current FAA commercial reusable spacecraft operator’s license. It is this statement regarding verification reports and receiving an FAA license that grabbed the attention of most investors.
SPCE shares jumped 27% on Monday closing at $26.89, immediately following the weekend test flight and the momentum just kept on going as the week progressed. At the time of writing, SPCE shares are up to $31.50 in the premarket. The test flight was well received by investors and analysts alike with Cannacord Genuity starting coverage of SPCE shares on Wednesday with a buy rating and a $35 price target.
SPCE stock forecast
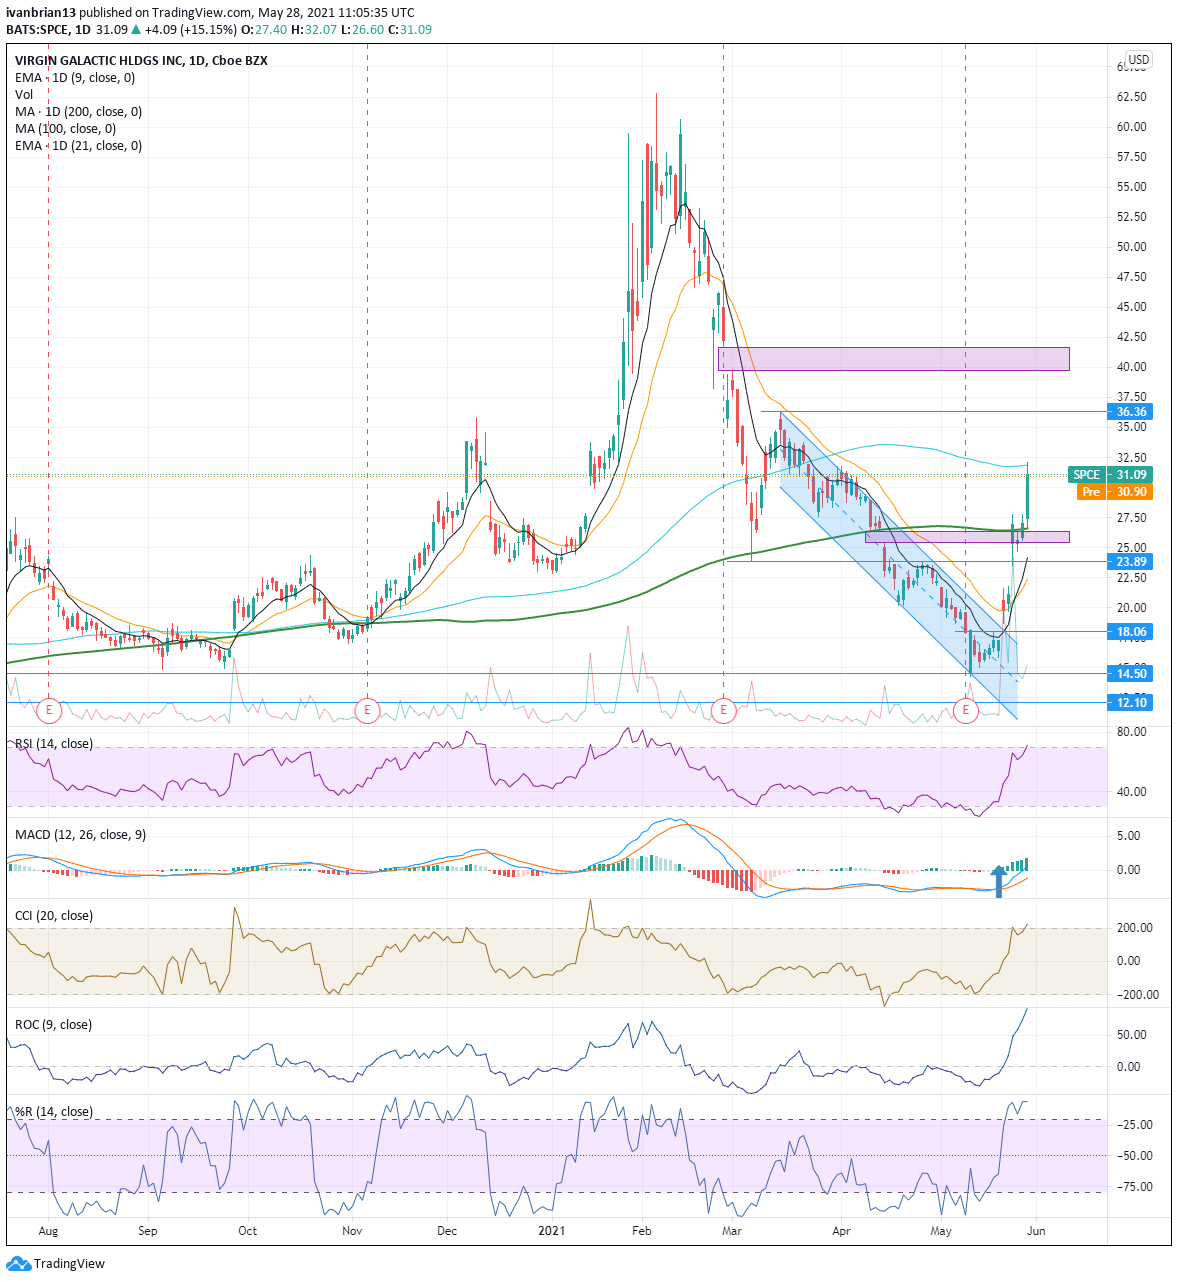
Virgin Galactic shares obviously surged after last weekend’s successful test flight and briefly stalled at the gap zone identified in the chart. FXStreet had identified this in advance as a target resistance. This level also corresponded with the 200-day moving average.
Thursday’s retail rally across most meme stocks set the boosters to full under SPCE shares and they duly broke out of this zone and launched up to the 100-day moving average resistance. Breaking the 100-day would see a push to the $36.36 resistance which is the high from mid-March. The market loves to fill a gap and the neat symmetry around this would send SPCE up to the next gap zone at $40. It worked for the previous gap so why not here. With the current fizz returning to the meme stock space this is not too stretched a target.
The bullish trend is held in place by the channel breakout so SPCE needs to clearly stay above this and not create a lower low so the $18.06 level is key to keep the bullish trend in place. Some of the momentum oscillators are beginning to look a little overbought but nothing too alarming just yet. The Relative Strength Index is close to overbought as is the Commodity Channel Index and the Willams %R actually is in overbought territory. In powerful trends, these can remain in the overbought zone for some time but these indicators combined are powerful so keep a cautious eye on these and manage risk carefully as always.
| Support | 26.60 200-day | 23.89 | 18.06 | 14.50 | 12.1 |
| Resistance | 31.89 100-day | 36.36 | 39.70 gap | 41.66 gap |
At the time of writing, the author has no position in any stock mentioned in this article and no business relationship with any company mentioned. The author has not received compensation for writing this article, other than from FXStreet.
This article is for information purposes only. The author and FXStreet are not registered investment advisors and nothing in this article is intended to be investment advice. It is important to perform your own research before making any investment and take independent advice from a registered investment advisor.
FXStreet and the author do not provide personalized recommendations. The author makes no representations as to accuracy, completeness, or the suitability of this information. FXStreet and the author will not be liable for any errors, omissions or any losses, injuries or damages arising from this information and its display or use. The author will not be held responsible for information that is found at the end of links posted on this page.
Errors and omissions excepted.

