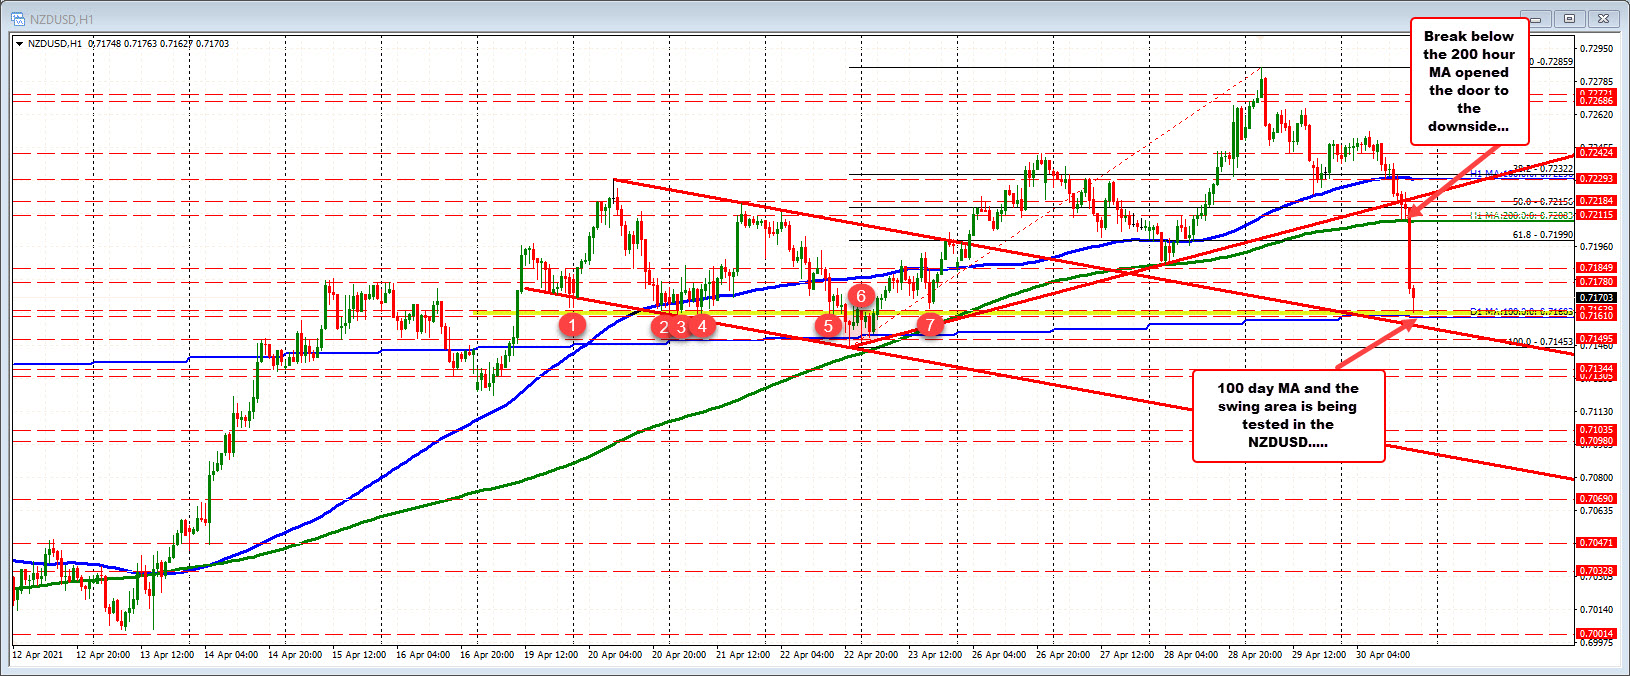
The 100 day MA is joined by swing area
The NZDUSD moves down to test the 100 day MA at 0.7161 and a swing area in the same area (see red numbered circles).
The price last tested the MA line on April 22 and April 23. There were minor breaks below that MA on that time but only briefly. A move below the 100 day MA (and staying below) would be needed to tilt the bias more to the downside.
For the week, the pair is now lower on the week. The price closed at 0.7196 last week.
This article was originally published by Forexlive.com. Read the original article here.